Bridgeport: Fire Incidents, Michigan (MI)
Where are fire incidents reported in Bridgeport, MI
Something went wrong! Please refresh the page.
|
| |||||||||||||||||||||||||||||||||||||||||||||||||||||||||||||||||||||||||||||||||||||||||||||||||||||||||||||
2002 - 2018 National Fire Incident Reporting System (NFIRS) incidents
- Incident types reported to NFIRS in Bridgeport, MI
- 82741.0%Rescue & EMS
- 38419.0%Fire
- 38419.0%Hazardous Condition
- 21510.6%Good Intent Call
- 1005.0%False Alarm
- 904.5%Service Call
- 110.5%Special Incident
- 60.3%Overpressure Rupture
- Fire incident types reported to NFIRS in Bridgeport, MI
- 14036.5%Structure Fires
- 12432.3%Outside Fires
- 10326.8%Mobile Property/Vehicle Fires
- 174.4%Other
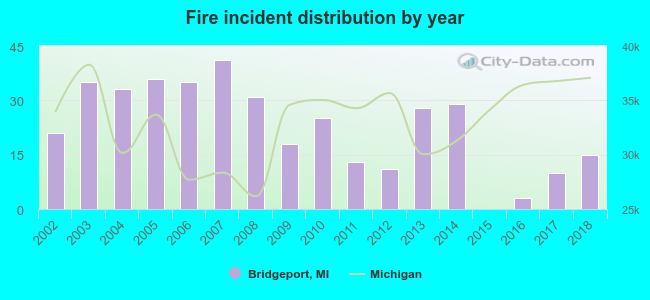 Based on the data from the years 2002 - 2018 the average number of fires per year is 23. The highest number of fires - 41 took place in 2007, and the least - 0 in 2015. The data has a decreasing trend.
The average number of yearly fire incidents per 10k residents in Bridgeport, MI compared to nearest cities:
(Note: Based on data for the last 3 years, including only cities with population 5,000 and above)
| Bridgeport: | 13.4 |
| Buena Vista: | 2.9 |
| Saginaw: | 121.3 |
| Carrollton: | 8.9 |
| Bay City: | 61.5 |
| Freeland: | 32.5 |
| Flushing: | 100.8 |
| Midland: | 37.2 |
| Flint: | 89.8 |
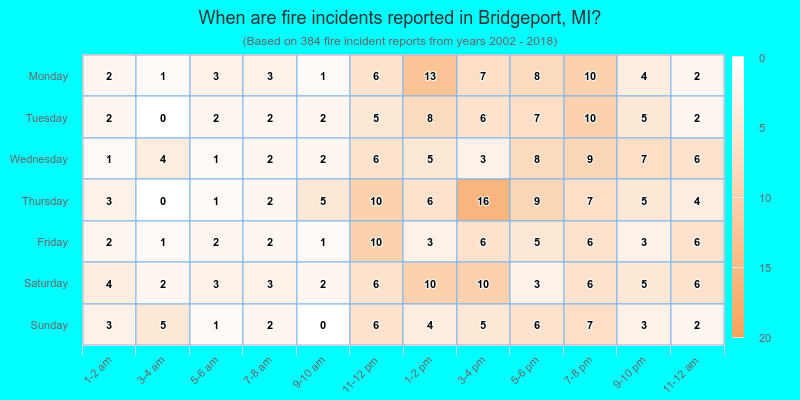
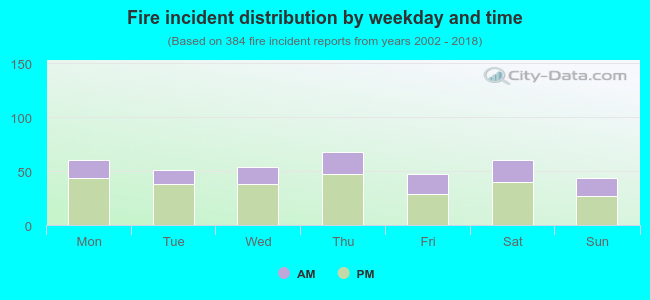 31.5% incidents where reported in the morning and 68.5% in the evening. The most fires (17.7%) took place on Thursday, and the least (11.5%) on Sunday.
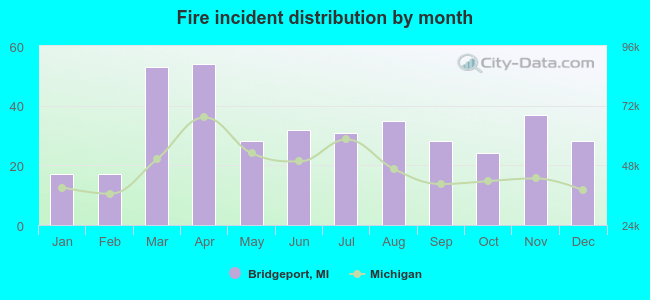 According to the 384 reports from years 2002 - 2018 most fires (14.1%) took place during April, and the least (4.4%) in January.
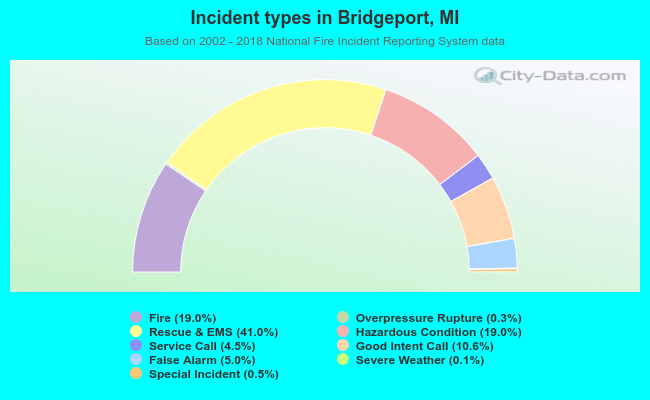 Out of all 2,019 cases reported during the years 2002 - 2018, the most belonged to the categories: Rescue & EMS (41.0%), Fire (19.0%), and Hazardous Condition (19.0%).
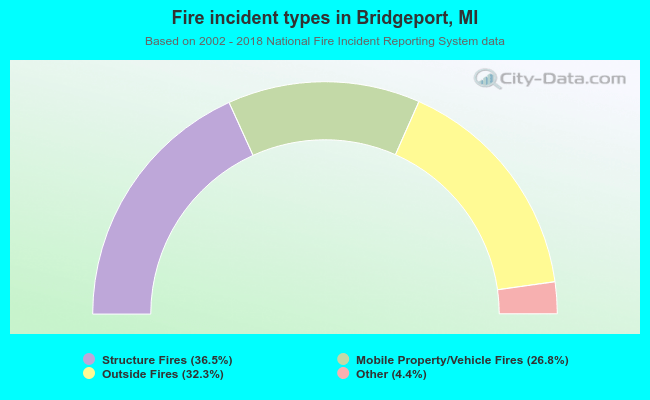 When looking into fire subcategories, the most reports belonged to: Structure Fires (36.5%), and Outside Fires (32.3%).