Bay City: Fire Incidents, Michigan (MI)
Where are fire incidents reported in Bay City, MI
Something went wrong! Please refresh the page.
| Fire incidents reported | |
|---|---|
| Sreet name | Count |
| EUCLID AVE | 148 |
| WILDER RD | 140 |
| MADISON AVE | 112 |
| MIDLAND RD | 98 |
| STATE STREET RD | 98 |
| VANBUREN ST | 98 |
| FITZHUGH ST | 90 |
| HENRY ST | 70 |
| CENTER AVE | 64 |
| WALNUT ST | 62 |
| MICHIGAN AVE | 56 |
| TWO MILE RD | 56 |
| WASHINGTON AVE | 56 |
| WHEELER RD | 56 |
| MARQUETTE AVE | 50 |
| SALZBURG RD | 50 |
| HURON RD | 48 |
| MACKINAW RD | 44 |
| BROADWAY | 42 |
| STATE PARK DR | 42 |
| GARFIELD AVE | 40 |
| LINN ST | 40 |
| FARRAGUT ST | 38 |
| MONROE ST | 38 |
| CASS AVE | 36 |
| COLUMBUS AVE | 36 |
| EUCLID | 36 |
| FRASER ST | 36 |
| STATE ST | 36 |
| WENONA AVE | 36 |
| Other | 1,502 |
2002 - 2018 National Fire Incident Reporting System (NFIRS) incidents
- Incident types reported to NFIRS in Bay City, MI
- 18,09952.6%Rescue & EMS
- 4,67513.6%Hazardous Condition
- 3,3549.8%Fire
- 2,7928.1%False Alarm
- 2,6527.7%Service Call
- 2,6167.6%Good Intent Call
- 1170.3%Special Incident
- 590.2%Overpressure Rupture
- 350.1%Severe Weather
- Fire incident types reported to NFIRS in Bay City, MI
- 1,55546.4%Structure Fires
- 1,06931.9%Outside Fires
- 55616.6%Mobile Property/Vehicle Fires
- 1745.2%Other
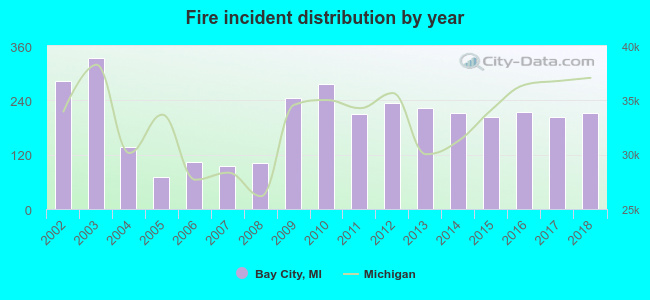 According to the data from the years 2002 - 2018 the average number of fires per year is 197. The highest number of reported fires - 333 took place in 2003, and the least - 70 in 2005. The data has a decreasing trend.
The average number of yearly fire incidents per 10k residents in Bay City, MI compared to nearest cities:
(Note: Based on data for the last 3 years, including only cities with population 5,000 and above)
| Bay City: | 61.5 |
| Carrollton: | 8.9 |
| Saginaw: | 121.3 |
| Buena Vista: | 2.9 |
| Freeland: | 32.5 |
| Bridgeport: | 13.4 |
| Midland: | 37.2 |
| Flushing: | 100.8 |
| Flint: | 89.8 |
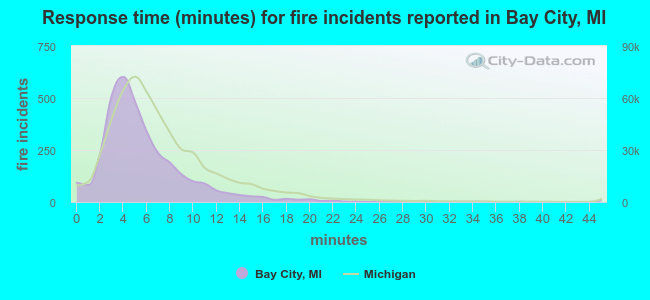 The median response time based on all reported fire incidents is 5 minutes. This is lower than the Michigan median value.
The median response time in Bay City, MI compared to nearest cities:
(Note: Based on data for all years, including only cities with at least 500 fire incidents)
| Bay City: | 5 minutes |
| Essexville: | 6 minutes |
| Saginaw: | 5 minutes |
| Midland: | 6 minutes |
| Pinconning: | 11 minutes |
| Hemlock: | 12 minutes |
| Birch Run: | 11 minutes |
| Burt: | 11 minutes |
| Sanford: | 8 minutes |
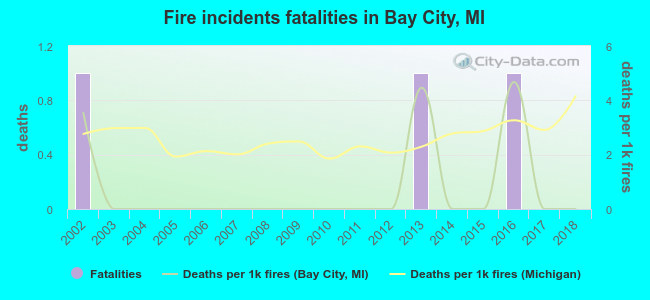 According to the data from the years 2002 - 2018 the average number of fire-related yearly deaths is 0. The highest number of deaths - 1 took place in 2002, and the lowest - 0 in 2003. The data has a decreasing trend.
The average number of fatalities per 1,000 fire incidents is 1. This indicator was the highest - 5 in 2016, and the lowest 0 in 2003. The trend for fatalities per 1,000 fires is declining. Compared to the state value the number of deaths per 1,000 fires is much lower.
According to the data from the years 2002 - 2018 the average number of fire-related yearly deaths is 0. The highest number of deaths - 1 took place in 2002, and the lowest - 0 in 2003. The data has a decreasing trend.
The average number of fatalities per 1,000 fire incidents is 1. This indicator was the highest - 5 in 2016, and the lowest 0 in 2003. The trend for fatalities per 1,000 fires is declining. Compared to the state value the number of deaths per 1,000 fires is much lower.
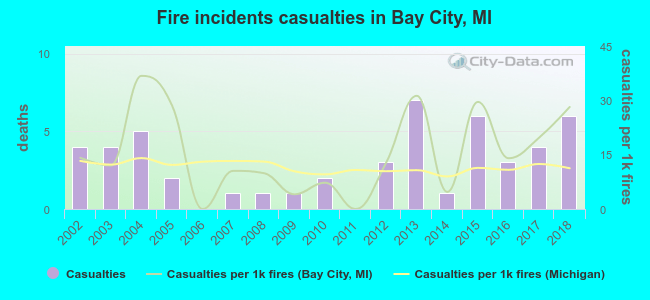 Based on the data from the years 2002 - 2018 the average number of fire-related yearly casualties is 3. The highest number of reported injuries - 7 took place in 2013, and the lowest - 0 in 2006. The data has a growing trend.
The average number of casualties per 1,000 fire incidents is 15. This indicator was the highest - 37 in 2004, and the lowest 0 in 2006. The trend for injuries per 1,000 fire incidents is rising. Compared to the Michigan value the number of injuries per 1,000 fire incidents is higher.
Based on the data from the years 2002 - 2018 the average number of fire-related yearly casualties is 3. The highest number of reported injuries - 7 took place in 2013, and the lowest - 0 in 2006. The data has a growing trend.
The average number of casualties per 1,000 fire incidents is 15. This indicator was the highest - 37 in 2004, and the lowest 0 in 2006. The trend for injuries per 1,000 fire incidents is rising. Compared to the Michigan value the number of injuries per 1,000 fire incidents is higher.Casualties per 1,000 incidents in Bay City, MI compared to nearest cities:
(Note: Based on data for all years, including only cities with at least 500 fire incidents)
| Bay City: | 14.9 |
| Essexville: | 1.9 |
| Saginaw: | 17.7 |
| Midland: | 18.8 |
| Pinconning: | 8.7 |
| Hemlock: | 1.8 |
| Birch Run: | 0.0 |
| Burt: | 5.8 |
| Sanford: | 6.3 |
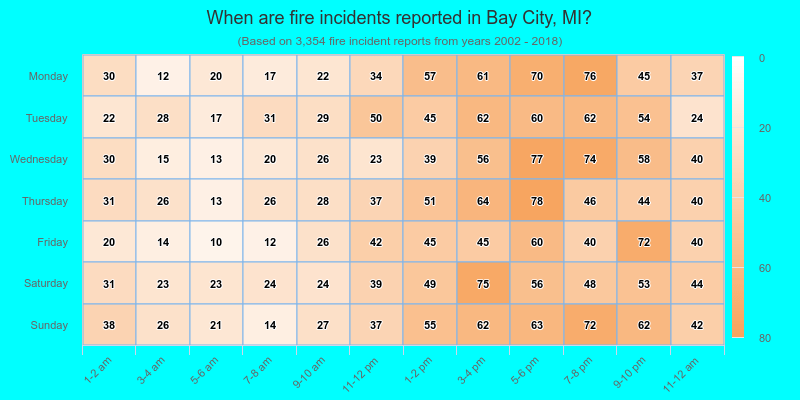
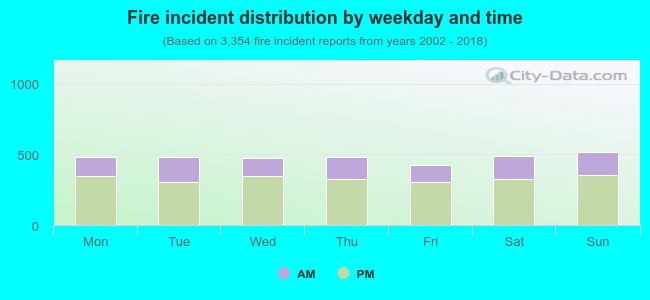 31.3% incidents where reported in the morning and 68.7% in the evening. The most fires (15.5%) took place on Sunday, and the least (12.7%) on Friday.
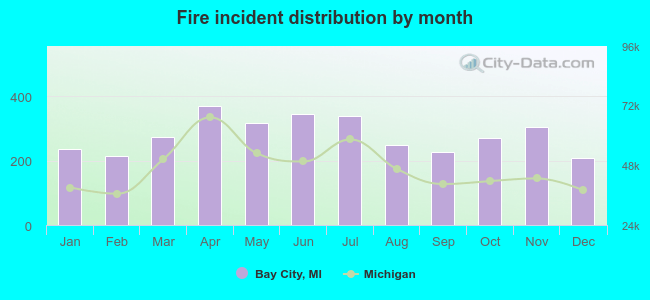 According to the 3,354 fires from years 2002 - 2018 most fires (11.1%) took place during April, and the least (6.2%) in December.
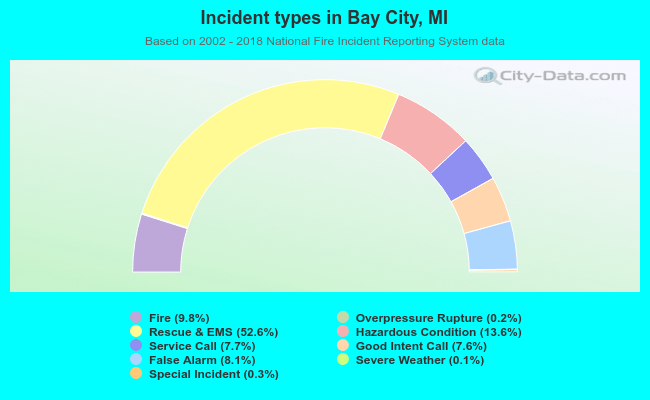 Out of all 34,399 cases reported during the years 2002 - 2018, the most belonged to the categories: Rescue & EMS (52.6%), Hazardous Condition (13.6%), and Fire (9.8%).
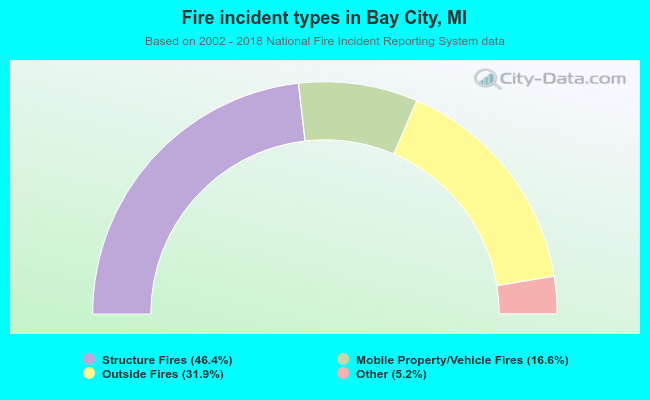 When looking into fire subcategories, the most incidents belonged to: Structure Fires (46.4%), and Outside Fires (31.9%).