Fairhope: Fire Incidents, Alabama (AL)
Where are fire incidents reported in Fairhope, AL
Something went wrong! Please refresh the page.
|
| |||||||||||||||||||||||||||||||||||||||||||||||||||||||||||||||||||||||||||||||||||||||||||||||||||||||||||||
2002 - 2018 National Fire Incident Reporting System (NFIRS) incidents
- Incident types reported to NFIRS in Fairhope, AL
- 1,20325.8%Rescue & EMS
- 1,05322.6%Fire
- 83217.9%Hazardous Condition
- 69414.9%Good Intent Call
- 58312.5%False Alarm
- 2615.6%Service Call
- 250.5%Severe Weather
- Fire incident types reported to NFIRS in Fairhope, AL
- 44942.6%Outside Fires
- 42940.7%Structure Fires
- 14613.9%Mobile Property/Vehicle Fires
- 292.8%Other
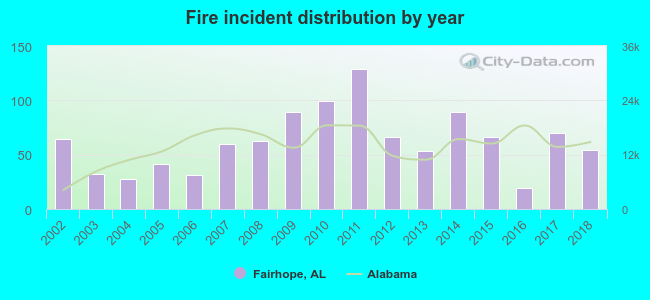 Based on the data from the years 2002 - 2018 the average number of fire incidents per year is 62. The highest number of reported fires - 129 took place in 2011, and the least - 19 in 2016. The data has a dropping trend.
The average number of yearly fire incidents per 10k residents in Fairhope, AL compared to nearest cities:
(Note: Based on data for the last 3 years, including only cities with population 5,000 and above)
| Fairhope: | 26.4 |
| Daphne: | 35.3 |
| Spanish Fort: | 34.2 |
| Robertsdale: | 38.7 |
| Foley: | 80.7 |
| Mobile: | 15.4 |
| Theodore: | 115.3 |
| Prichard: | 37.1 |
| Chickasaw: | 1.7 |
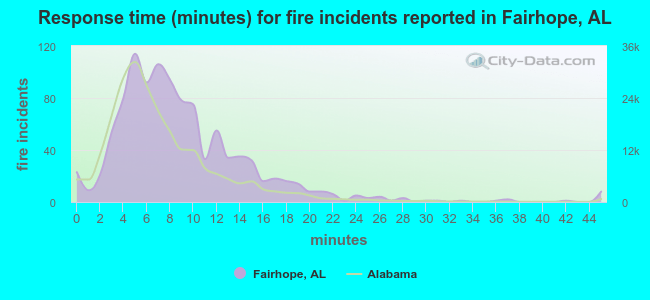 The median response time based on all reported fire incidents is 8 minutes. This is higher than the Alabama median value.
The median response time in Fairhope, AL compared to nearest cities:
(Note: Based on data for all years, including only cities with at least 500 fire incidents)
| Fairhope: | 8 minutes |
| Daphne: | 6 minutes |
| Foley: | 7 minutes |
| Mobile: | 7 minutes |
| Theodore: | 7 minutes |
| Prichard: | 5 minutes |
| Gulf Shores: | 5 minutes |
| Saraland: | 5 minutes |
| Satsuma: | 4 minutes |
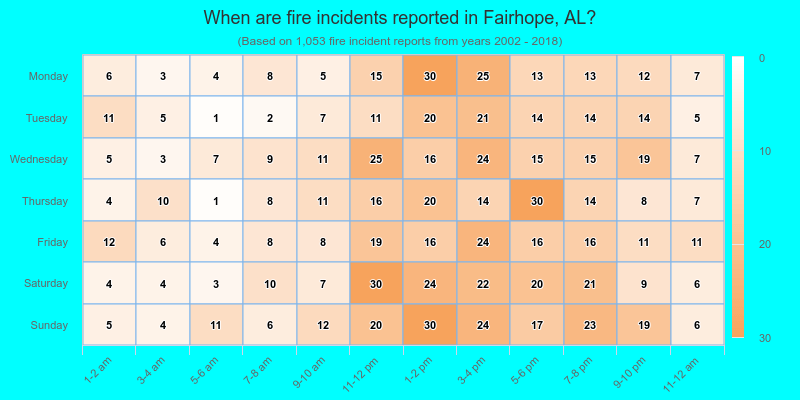
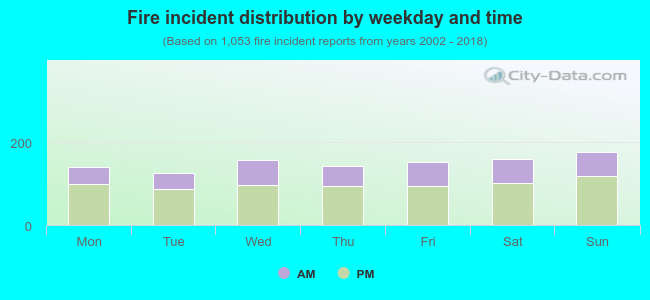 34.3% incidents where reported in the morning and 65.7% in the evening. The most fires (16.8%) took place on Sunday, and the least (11.9%) on Tuesday.
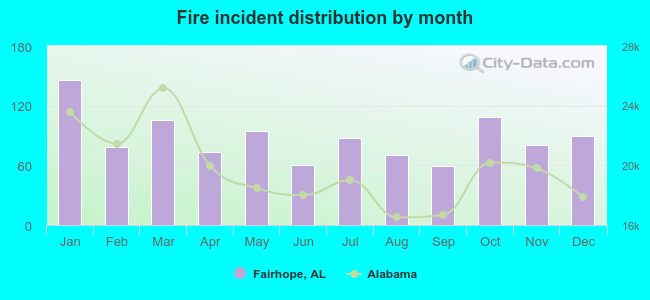 Based on the 1,053 reports from years 2002 - 2018 most fires (13.9%) took place during January, and the least (5.6%) in September.
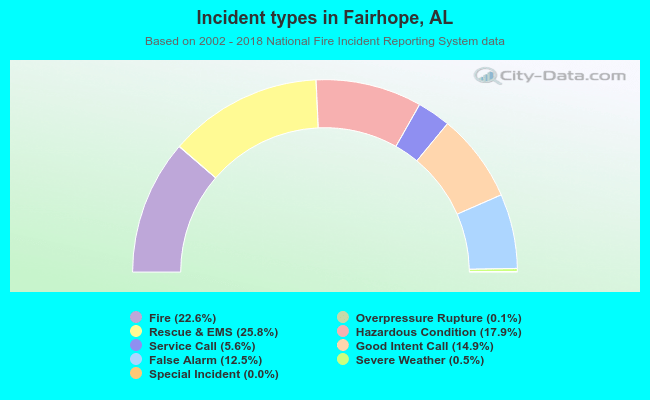 Out of all 4,656 cases reported during the years 2002 - 2018, the most belonged to the categories: Rescue & EMS (25.8%), Fire (22.6%), and Hazardous Condition (17.9%).
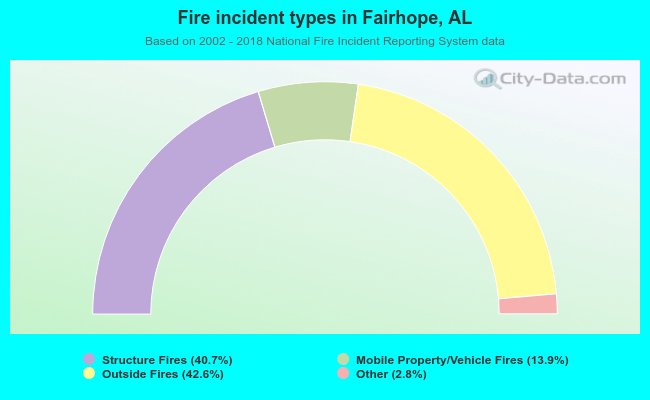 When looking into fire subcategories, the most incidents belonged to: Outside Fires (42.6%), and Structure Fires (40.7%).