Spanish Fort: Fire Incidents, Alabama (AL)
Where are fire incidents reported in Spanish Fort, AL
Something went wrong! Please refresh the page.
|
| |||||||||||||||||||||||||||||||||||||||||||||||||||||||||||||||||||||||||||||||||||||||||||||||||||||||||||||
2002 - 2018 National Fire Incident Reporting System (NFIRS) incidents
- Incident types reported to NFIRS in Spanish Fort, AL
- 78339.6%Rescue & EMS
- 34517.4%Fire
- 33016.7%False Alarm
- 1919.7%Good Intent Call
- 1909.6%Hazardous Condition
- 1276.4%Service Call
- 70.4%Severe Weather
- 30.2%Overpressure Rupture
- 20.1%Special Incident
- Fire incident types reported to NFIRS in Spanish Fort, AL
- 14140.9%Outside Fires
- 12235.4%Structure Fires
- 7822.6%Mobile Property/Vehicle Fires
- 41.2%Other
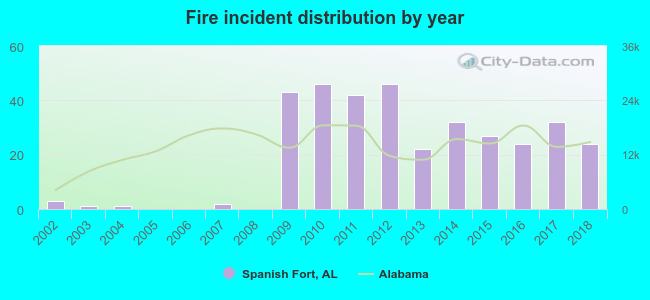 Based on the data from the years 2002 - 2018 the average number of fire incidents per year is 20. The highest number of reported fires - 46 took place in 2010, and the least - 0 in 2005. The data has a growing trend.
The average number of yearly fire incidents per 10k residents in Spanish Fort, AL compared to nearest cities:
(Note: Based on data for the last 3 years, including only cities with population 5,000 and above)
| Spanish Fort: | 34.2 |
| Daphne: | 35.3 |
| Fairhope: | 26.4 |
| Mobile: | 15.4 |
| Chickasaw: | 1.7 |
| Prichard: | 37.1 |
| Saraland: | 41.2 |
| Satsuma: | 58.4 |
| Robertsdale: | 38.7 |
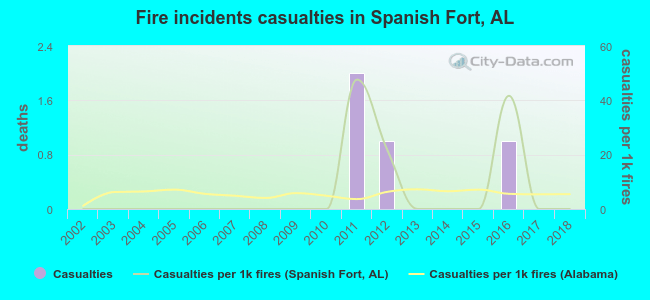 According to the reports from the years 2002 - 2018 the average number of fire-related casualties per year is 0. The highest number of reported injuries - 2 took place in 2011, and the lowest - 0 in 2002. The data has a constant trend.
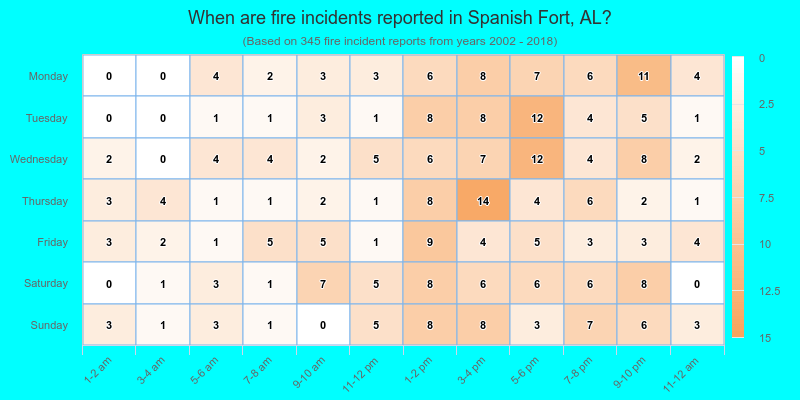
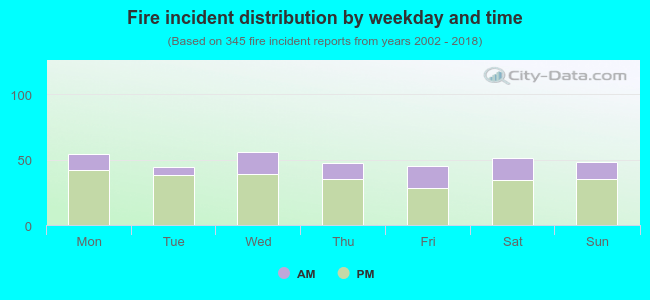 27.2% incidents where reported in the morning and 72.8% in the evening. The most fires (16.2%) took place on Wednesday, and the least (12.8%) on Tuesday.
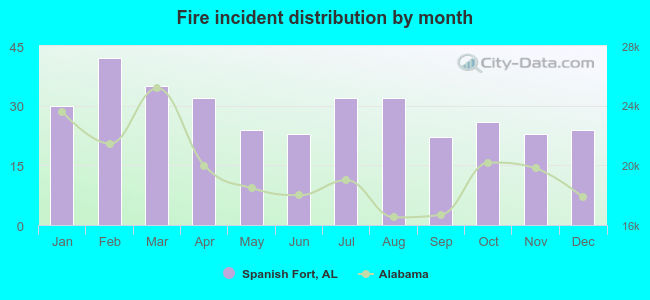 According to the 345 reports from years 2002 - 2018 most fires (12.2%) took place during February, and the least (6.4%) in September.
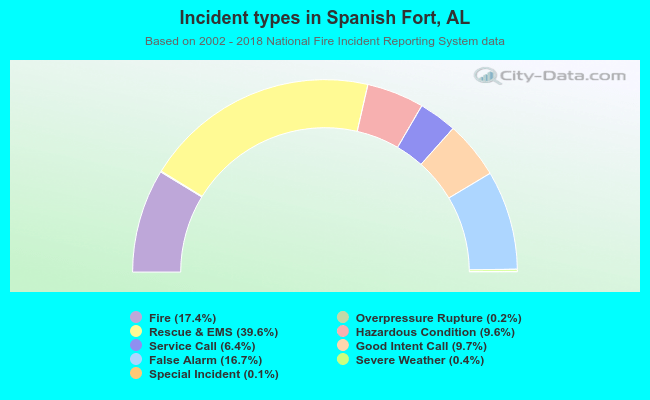 Out of all 1,978 cases reported during the years 2002 - 2018, the most belonged to the categories: Rescue & EMS (39.6%), Fire (17.4%), and False Alarm (16.7%).
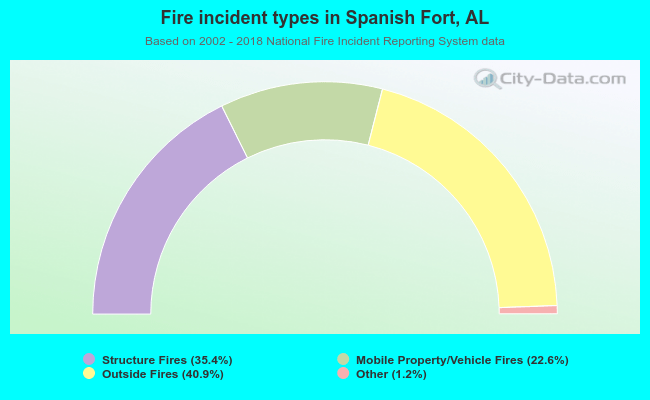 When looking into fire subcategories, the most reports belonged to: Outside Fires (40.9%), and Structure Fires (35.4%).