Daphne: Fire Incidents, Alabama (AL)
Where are fire incidents reported in Daphne, AL
Something went wrong! Please refresh the page.
| Fire incidents reported | |
|---|---|
| Sreet name | Count |
| US HIGHWAY 98 HWY | 607 |
| INTERSTATE 10 INT | 313 |
| US HIGHWAY 90 HWY | 194 |
| MAIN ST | 168 |
| POLLARD RD | 165 |
| INTERSTATE 10 | 146 |
| STATE HIGHWAY 181 HWY | 132 |
| RIDGEWOOD DR | 106 |
| COUNTY ROAD 13 RD | 91 |
| WHISPERING PINES RD | 73 |
| LAKE FOREST BLVD | 72 |
| JACKSON ST | 68 |
| DAPHMONT DR | 52 |
| EAST BAY DR | 51 |
| JOHNSON RD | 41 |
| LAKE FRONT DR | 39 |
| DAPHNE AVE | 35 |
| VAN AVE | 35 |
| LAWSON RD | 34 |
| PARK DR | 33 |
| SEA CLIFF DR | 33 |
| STANTON RD | 33 |
| BAYVIEW DR | 32 |
| ROLLING HILL DR | 32 |
| FREDERICK BLVD | 30 |
| YACHT CLUB DR | 30 |
| CANTERBURY RD | 29 |
| MONTCLAIR LOOP | 29 |
| PALISADE CIR | 29 |
| TIMBERCREEK BLVD | 28 |
2002 - 2018 National Fire Incident Reporting System (NFIRS) incidents
- Incident types reported to NFIRS in Daphne, AL
- 10,12865.2%Rescue & EMS
- 1,2337.9%False Alarm
- 1,1317.3%Fire
- 1,1317.3%Service Call
- 1,0797.0%Good Intent Call
- 7564.9%Hazardous Condition
- 310.2%Special Incident
- 220.1%Severe Weather
- Fire incident types reported to NFIRS in Daphne, AL
- 46641.2%Structure Fires
- 41436.6%Outside Fires
- 23520.8%Mobile Property/Vehicle Fires
- 161.4%Other
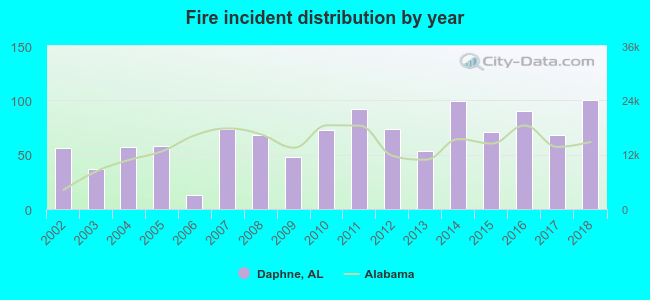 Based on the data from the years 2002 - 2018 the average number of fires per year is 67. The highest number of reported fire incidents - 100 took place in 2018, and the least - 13 in 2006. The data has an increasing trend.
The average number of yearly fire incidents per 10k residents in Daphne, AL compared to nearest cities:
(Note: Based on data for the last 3 years, including only cities with population 5,000 and above)
| Daphne: | 35.3 |
| Spanish Fort: | 34.2 |
| Fairhope: | 26.4 |
| Robertsdale: | 38.7 |
| Mobile: | 15.4 |
| Chickasaw: | 1.7 |
| Prichard: | 37.1 |
| Saraland: | 41.2 |
| Satsuma: | 58.4 |
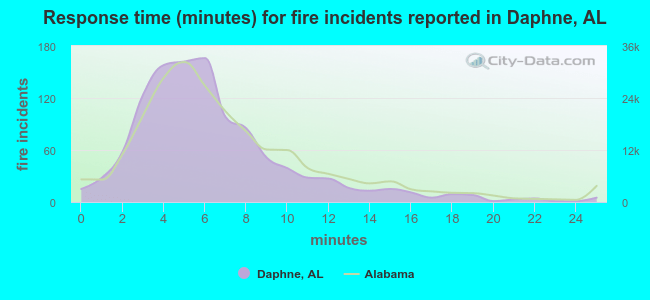 The median response time based on all reported fire incidents is 6 minutes. This is similar to the state median value.
The median response time in Daphne, AL compared to nearest cities:
(Note: Based on data for all years, including only cities with at least 500 fire incidents)
| Daphne: | 6 minutes |
| Fairhope: | 8 minutes |
| Mobile: | 7 minutes |
| Prichard: | 5 minutes |
| Saraland: | 5 minutes |
| Satsuma: | 4 minutes |
| Theodore: | 7 minutes |
| Bay Minette: | 5 minutes |
| Foley: | 7 minutes |
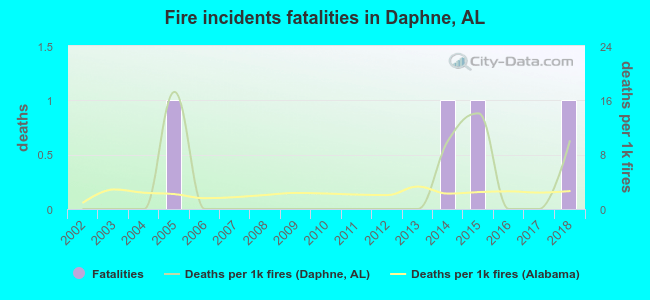 According to the reports from the years 2002 - 2018 the average number of fire-related fatalities per year is 0. The highest number of reported deaths - 1 took place in 2005, and the lowest - 0 in 2002. The data has a rising trend.
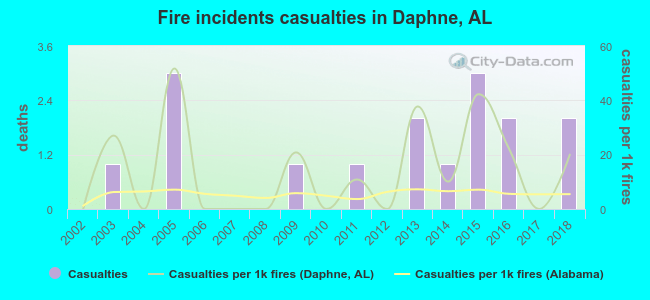 According to the data from the years 2002 - 2018 the average number of fire-related casualties per year is 1. The highest number of casualties - 3 took place in 2005, and the lowest - 0 in 2002. The data has a rising trend.
The average number of injuries per 1,000 fires is 14. This indicator was the highest - 52 in 2005, and the lowest 0 in 2002. The trend for casualties per 1,000 incidents is rising. Compared to the state value the number of casualties per 1,000 incidents is much higher.
According to the data from the years 2002 - 2018 the average number of fire-related casualties per year is 1. The highest number of casualties - 3 took place in 2005, and the lowest - 0 in 2002. The data has a rising trend.
The average number of injuries per 1,000 fires is 14. This indicator was the highest - 52 in 2005, and the lowest 0 in 2002. The trend for casualties per 1,000 incidents is rising. Compared to the state value the number of casualties per 1,000 incidents is much higher.
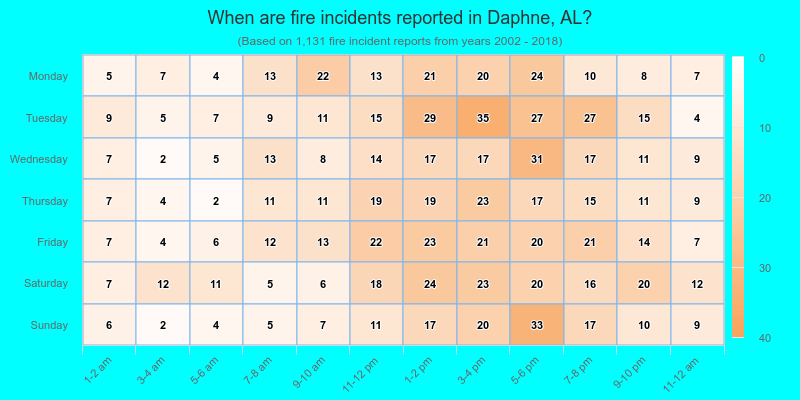
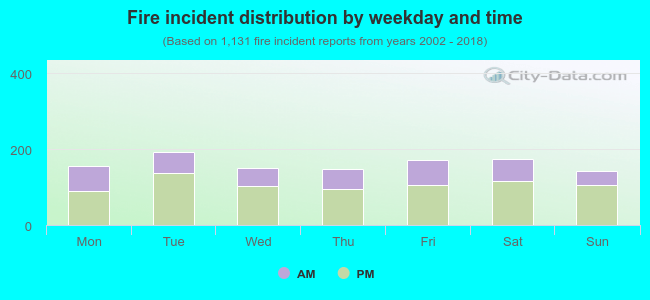 33.7% incidents where reported in the morning and 66.3% in the evening. The most fires (17.1%) took place on Tuesday, and the least (12.5%) on Sunday.
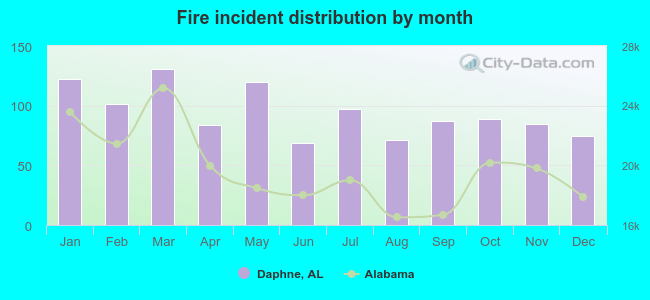 According to the 1,131 fire incidents from years 2002 - 2018 most fires (11.6%) took place during March, and the least (6.1%) in June.
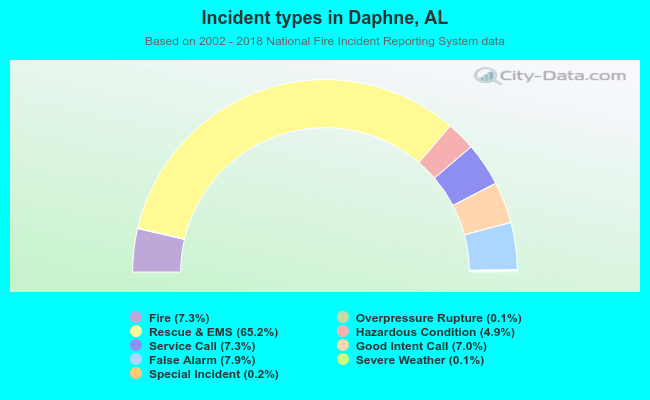 Out of all 15,522 cases reported during the years 2002 - 2018, the most belonged to the categories: Rescue & EMS (65.2%), False Alarm (7.9%), and Fire (7.3%).
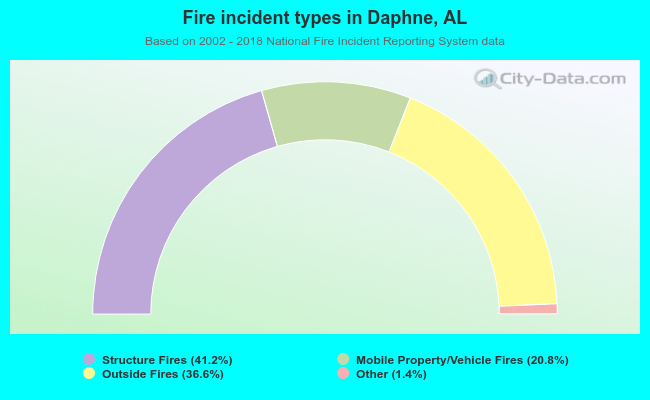 When looking into fire subcategories, the most incidents belonged to: Structure Fires (41.2%), and Outside Fires (36.6%).