Franklin: Fire Incidents, Wisconsin (WI)
Where are fire incidents reported in Franklin, WI
Something went wrong! Please refresh the page.
| Fire incidents reported | |
|---|---|
| Sreet name | Count |
| 27TH ST | 140 |
| 35TH ST | 84 |
| LOOMIS RD | 74 |
| RAWSON AVE | 62 |
| RYAN RD | 54 |
| FOREST HOME AVE | 46 |
| 51ST ST | 42 |
| CORTEZ CIR | 42 |
| COLLEGE AVE | 38 |
| 76TH ST | 32 |
| FRANKLIN DR | 32 |
| OAKWOOD PARK DR | 30 |
| 124TH ST | 28 |
| DREXEL AVE | 26 |
| 68TH ST | 24 |
| ST MARTINS RD | 24 |
| OAKWOOD RD | 22 |
| RYAN GREEN CT | 22 |
| 60TH ST | 20 |
| 116TH ST | 18 |
| PARKEDGE CIR | 16 |
| PUETZ RD | 16 |
| 31ST ST | 14 |
| 36TH ST | 14 |
| COLLEGE | 14 |
| DORY DR | 14 |
| DREXEL | 14 |
| FOREST HILL AVE | 14 |
| FRANKLIN TER | 14 |
| SCEPTER DR | 14 |
| Other | 32 |
2002 - 2018 National Fire Incident Reporting System (NFIRS) incidents
- Incident types reported to NFIRS in Franklin, WI
- 1,19825.3%False Alarm
- 1,03621.8%Fire
- 1,03421.8%Hazardous Condition
- 75315.9%Service Call
- 3777.9%Good Intent Call
- 2565.4%Rescue & EMS
- 831.7%Special Incident
- 60.1%Overpressure Rupture
- Fire incident types reported to NFIRS in Franklin, WI
- 63261.0%Structure Fires
- 23622.8%Outside Fires
- 959.2%Mobile Property/Vehicle Fires
- 737.0%Other
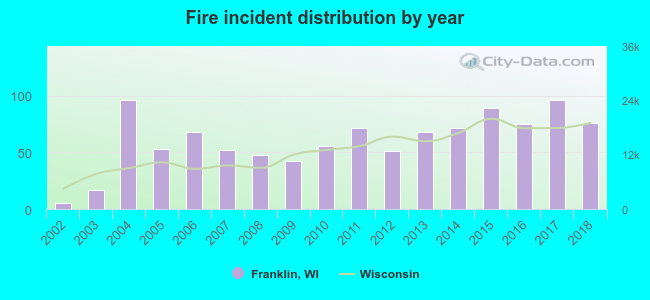 According to the data from the years 2002 - 2018 the average number of fire incidents per year is 61. The highest number of fires - 96 took place in 2004, and the least - 5 in 2002. The data has an increasing trend.
The average number of yearly fire incidents per 10k residents in Franklin, WI compared to nearest cities:
(Note: Based on data for the last 3 years, including only cities with population 5,000 and above)
| Franklin: | 22.7 |
| Greendale: | 17.0 |
| Hales Corners: | 25.4 |
| Greenfield: | 14.3 |
| Oak Creek: | 30.0 |
| Muskego: | 17.2 |
| South Milwaukee: | 23.5 |
| West Allis: | 18.9 |
| New Berlin: | 28.9 |
 The median response time based on all reported fire incidents is 6 minutes. This is comparable to the Wisconsin median value.
The median response time in Franklin, WI compared to nearest cities:
(Note: Based on data for all years, including only cities with at least 500 fire incidents)
| Franklin: | 6 minutes |
| Greenfield: | 6 minutes |
| Oak Creek: | 6 minutes |
| Muskego: | 7 minutes |
| South Milwaukee: | 3 minutes |
| West Allis: | 4 minutes |
| New Berlin: | 7 minutes |
| Cudahy: | 3 minutes |
| Milwaukee: | 4 minutes |
 Based on the reports from the years 2002 - 2018 the average number of fire-related yearly casualties is 1. The highest number of reported casualties - 4 took place in 2015, and the lowest - 0 in 2002. The data has a rising trend.
The average number of casualties per 1,000 fires is 8. This indicator was the highest - 45 in 2015, and the lowest 0 in 2002. The trend for injuries per 1,000 fire incidents is rising. Compared to the Wisconsin value the number of injuries per 1,000 fires is similar.
Based on the reports from the years 2002 - 2018 the average number of fire-related yearly casualties is 1. The highest number of reported casualties - 4 took place in 2015, and the lowest - 0 in 2002. The data has a rising trend.
The average number of casualties per 1,000 fires is 8. This indicator was the highest - 45 in 2015, and the lowest 0 in 2002. The trend for injuries per 1,000 fire incidents is rising. Compared to the Wisconsin value the number of injuries per 1,000 fires is similar.Casualties per 1,000 incidents in Franklin, WI compared to nearest cities:
(Note: Based on data for all years, including only cities with at least 500 fire incidents)
| Franklin: | 11.6 |
| Greenfield: | 4.0 |
| Oak Creek: | 15.1 |
| Muskego: | 0.0 |
| South Milwaukee: | 18.4 |
| West Allis: | 53.5 |
| New Berlin: | 7.1 |
| Cudahy: | 8.5 |
| Milwaukee: | 1.6 |
 34.3% incidents where reported in the morning and 65.7% in the evening. The most fires (15.8%) took place on Saturday, and the least (12.8%) on Tuesday.
 Based on the 1,036 fires from years 2002 - 2018 most fires (12.2%) took place during June, and the least (5.4%) in September.
 Out of all 4,744 cases reported during the years 2002 - 2018, the most belonged to the categories: False Alarm (25.3%), Fire (21.8%), and Hazardous Condition (21.8%).
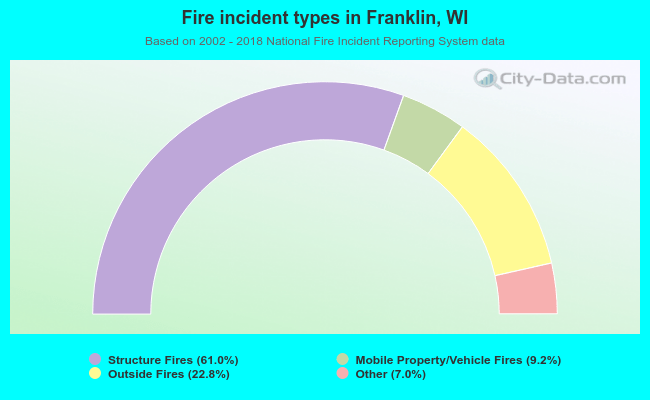 When looking into fire subcategories, the most incidents belonged to: Structure Fires (61.0%), and Outside Fires (22.8%).