West Allis: Fire Incidents, Wisconsin (WI)
Where are fire incidents reported in West Allis, WI
Something went wrong! Please refresh the page.
| Fire incidents reported | |
|---|---|
| Sreet name | Count |
| GREENFIELD AVE | 266 |
| NATIONAL AVE | 166 |
| 108 ST | 146 |
| LINCOLN AVE | 132 |
| OKLAHOMA AVE | 108 |
| BELOIT RD | 90 |
| 76 ST | 80 |
| 60 ST | 62 |
| 84 ST | 62 |
| 75 ST | 60 |
| 83 ST | 56 |
| BURNHAM ST | 52 |
| 71 ST | 50 |
| 70 ST | 48 |
| 62 ST | 46 |
| 68 ST | 46 |
| 72 ST | 46 |
| 92 ST | 44 |
| 116 ST | 42 |
| 108 | 40 |
| 65 ST | 40 |
| CLEVELAND AVE | 40 |
| BECHER ST | 38 |
| GREENFIELD | 38 |
| 63 ST | 36 |
| 73 ST | 36 |
| 74 ST | 36 |
| 59 ST | 34 |
| 77 ST | 34 |
| 102 ST | 32 |
2002 - 2018 National Fire Incident Reporting System (NFIRS) incidents
- Incident types reported to NFIRS in West Allis, WI
- 38,68177.5%Rescue & EMS
- 3,4246.9%False Alarm
- 3,1366.3%Hazardous Condition
- 1,9243.9%Fire
- 1,5593.1%Service Call
- 1,0992.2%Good Intent Call
- Fire incident types reported to NFIRS in West Allis, WI
- 93348.5%Structure Fires
- 54228.2%Outside Fires
- 39920.7%Mobile Property/Vehicle Fires
- 502.6%Other
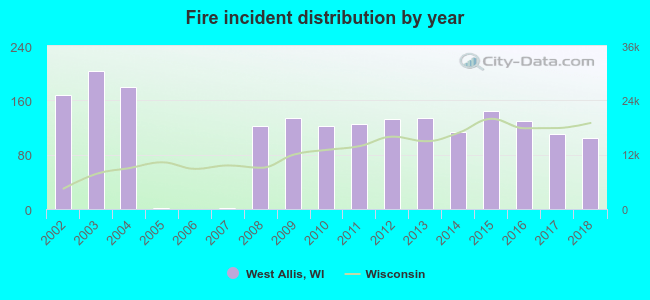 Based on the data from the years 2002 - 2018 the average number of fires per year is 113. The highest number of reported fire incidents - 203 took place in 2003, and the least - 0 in 2006. The data has a decreasing trend.
The average number of yearly fire incidents per 10k residents in West Allis, WI compared to nearest cities:
(Note: Based on data for the last 3 years, including only cities with population 5,000 and above)
| West Allis: | 18.9 |
| Greenfield: | 14.3 |
| Wauwatosa: | 16.1 |
| Milwaukee: | 33.6 |
| Elm Grove: | 13.0 |
| Hales Corners: | 25.4 |
| Greendale: | 17.0 |
| New Berlin: | 28.9 |
| Brookfield: | 23.3 |
 The median response time based on all reported fire incidents is 4 minutes. This is lower compared to the state median value.
The median response time in West Allis, WI compared to nearest cities:
(Note: Based on data for all years, including only cities with at least 500 fire incidents)
| West Allis: | 4 minutes |
| Greenfield: | 6 minutes |
| Wauwatosa: | 6 minutes |
| Milwaukee: | 4 minutes |
| New Berlin: | 7 minutes |
| Brookfield: | 7 minutes |
| Franklin: | 6 minutes |
| Cudahy: | 3 minutes |
| Muskego: | 7 minutes |
 Based on the data from the years 2002 - 2018 the average number of fire-related fatalities per year is 0. The highest number of reported deaths - 3 took place in 2004, and the lowest - 0 in 2003. The data has a decreasing trend.
 According to the data from the years 2002 - 2018 the average number of fire-related casualties per year is 6. The highest number of reported casualties - 14 took place in 2008, and the lowest - 0 in 2005. The data has a decreasing trend.
The average number of injuries per 1,000 fires is 46. This indicator was the highest - 115 in 2008, and the lowest 0 in 2005. The trend for casualties per 1,000 incidents is declining. Compared to the Wisconsin value the number of injuries per 1,000 incidents is much higher.
According to the data from the years 2002 - 2018 the average number of fire-related casualties per year is 6. The highest number of reported casualties - 14 took place in 2008, and the lowest - 0 in 2005. The data has a decreasing trend.
The average number of injuries per 1,000 fires is 46. This indicator was the highest - 115 in 2008, and the lowest 0 in 2005. The trend for casualties per 1,000 incidents is declining. Compared to the Wisconsin value the number of injuries per 1,000 incidents is much higher.Casualties per 1,000 incidents in West Allis, WI compared to nearest cities:
(Note: Based on data for all years, including only cities with at least 500 fire incidents)
| West Allis: | 53.5 |
| Greenfield: | 4.0 |
| Wauwatosa: | 28.7 |
| Milwaukee: | 1.6 |
| New Berlin: | 7.1 |
| Brookfield: | 21.0 |
| Franklin: | 11.6 |
| Cudahy: | 8.5 |
| Muskego: | 0.0 |
 31.3% incidents where reported in the morning and 68.7% in the evening. The most fires (15.0%) took place on Saturday, and the least (13.1%) on Friday.
 According to the 1,924 incident reports from years 2002 - 2018 most fires (11.0%) took place during July, and the least (5.5%) in February.
 Out of all 49,885 cases reported during the years 2002 - 2018, the most belonged to the categories: Rescue & EMS (77.5%), False Alarm (6.9%), and Hazardous Condition (6.3%).
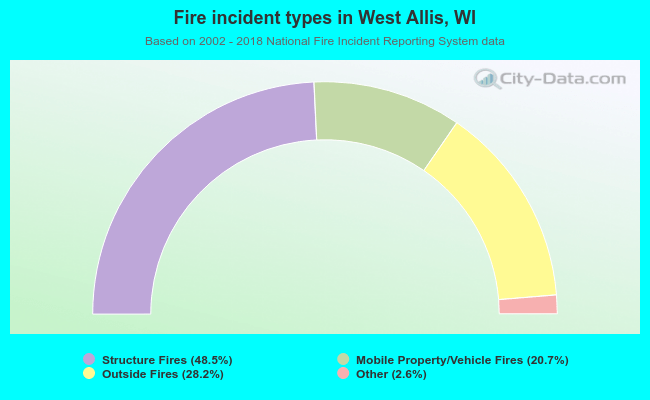 When looking into fire subcategories, the most reports belonged to: Structure Fires (48.5%), and Outside Fires (28.2%).