New Lenox: Fire Incidents, Illinois (IL)
Where are fire incidents reported in New Lenox, IL
Something went wrong! Please refresh the page.
| Fire incidents reported | |
|---|---|
| Sreet name | Count |
| LINCOLN HWY | 192 |
| CEDAR RD | 170 |
| SPENCER RD | 108 |
| LARAWAY RD | 78 |
| MAPLE RD | 78 |
| SCHOOLHOUSE RD | 76 |
| MAPLE ST | 74 |
| FRANCIS RD | 70 |
| ILLINOIS HWY | 66 |
| NELSON RD | 58 |
| JOLIET HWY | 54 |
| HAVEN AVE | 50 |
| GOUGAR RD | 46 |
| I80 MM 140 | 34 |
| MARLEY RD | 32 |
| PARKER RD | 32 |
| ROUTE 6 | 30 |
| DELANEY RD | 28 |
| I80 MM 137 | 28 |
| REGAN RD | 28 |
| SILVER CROSS BLVD | 28 |
| ANDERSON RD | 26 |
| MAPLE | 26 |
| SOUTHGATE RD | 24 |
| CIRCLE DR | 22 |
| PINE ST | 22 |
| I-80 EAST BOUND | 20 |
| I80 MM 141 | 20 |
| PRAIRIE RD | 20 |
| STONEBRIDGE DR | 20 |
| Other | 368 |
2002 - 2018 National Fire Incident Reporting System (NFIRS) incidents
- Incident types reported to NFIRS in New Lenox, IL
- 9,55955.7%Rescue & EMS
- 2,22413.0%False Alarm
- 1,92811.2%Fire
- 1,3778.0%Hazardous Condition
- 1,0586.2%Good Intent Call
- 9315.4%Service Call
- 550.3%Special Incident
- Fire incident types reported to NFIRS in New Lenox, IL
- 81442.2%Outside Fires
- 61231.7%Structure Fires
- 34217.7%Mobile Property/Vehicle Fires
- 1608.3%Other
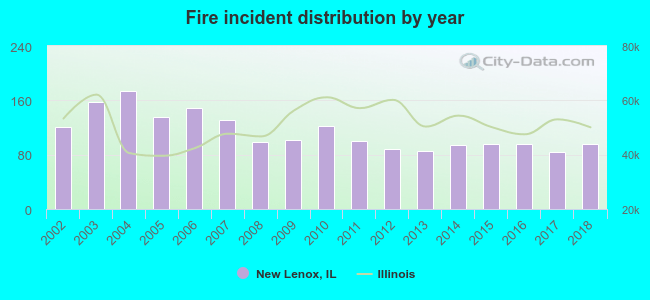 According to the data from the years 2002 - 2018 the average number of fire incidents per year is 113. The highest number of fires - 174 took place in 2004, and the least - 84 in 2017. The data has a declining trend.
The average number of yearly fire incidents per 10k residents in New Lenox, IL compared to nearest cities:
(Note: Based on data for the last 3 years, including only cities with population 5,000 and above)
| New Lenox: | 36.1 |
| Mokena: | 44.2 |
| Manhattan: | 60.7 |
| Frankfort: | 46.4 |
| Homer Glen: | 31.7 |
| Lockport: | 43.1 |
| Joliet: | 28.1 |
| Crest Hill: | 23.6 |
| Orland Hills: | 24.7 |
 The median response time based on all reported fire incidents is 6 minutes. This is similar to the state median value.
The median response time in New Lenox, IL compared to nearest cities:
(Note: Based on data for all years, including only cities with at least 500 fire incidents)
| New Lenox: | 6 minutes |
| Mokena: | 6 minutes |
| Manhattan: | 6 minutes |
| Frankfort: | 6 minutes |
| Homer Glen: | 6 minutes |
| Lockport: | 5 minutes |
| Joliet: | 5 minutes |
| Crest Hill: | 5 minutes |
| Orland Park: | 5 minutes |
 Based on the data from the years 2002 - 2018 the average number of fire-related fatalities per year is 0. The highest number of deaths - 1 took place in 2004, and the lowest - 0 in 2002. The data has a constant trend.
 According to the reports from the years 2002 - 2018 the average number of fire-related yearly casualties is 0. The highest number of reported injuries - 3 took place in 2002, and the lowest - 0 in 2003. The data has a dropping trend.
The average number of casualties per 1,000 fire incidents is 4. This indicator was the highest - 25 in 2002, and the lowest 0 in 2003. The trend for injuries per 1,000 fire incidents is dropping. Compared to the state value the number of casualties per 1,000 fire incidents is much lower.
According to the reports from the years 2002 - 2018 the average number of fire-related yearly casualties is 0. The highest number of reported injuries - 3 took place in 2002, and the lowest - 0 in 2003. The data has a dropping trend.
The average number of casualties per 1,000 fire incidents is 4. This indicator was the highest - 25 in 2002, and the lowest 0 in 2003. The trend for injuries per 1,000 fire incidents is dropping. Compared to the state value the number of casualties per 1,000 fire incidents is much lower.Casualties per 1,000 incidents in New Lenox, IL compared to nearest cities:
(Note: Based on data for all years, including only cities with at least 500 fire incidents)
| New Lenox: | 3.6 |
| Mokena: | 3.4 |
| Manhattan: | 8.9 |
| Frankfort: | 6.0 |
| Homer Glen: | 8.4 |
| Lockport: | 16.0 |
| Joliet: | 4.2 |
| Crest Hill: | 11.5 |
| Orland Park: | 12.9 |
 30.8% incidents where reported in the morning and 69.2% in the evening. The most fires (16.3%) took place on Saturday, and the least (12.8%) on Monday.
 According to the 1,928 reports from years 2002 - 2018 most fires (12.3%) took place during April, and the least (5.1%) in December.
 Out of all 17,161 cases reported during the years 2002 - 2018, the most belonged to the categories: Rescue & EMS (55.7%), False Alarm (13.0%), and Fire (11.2%).
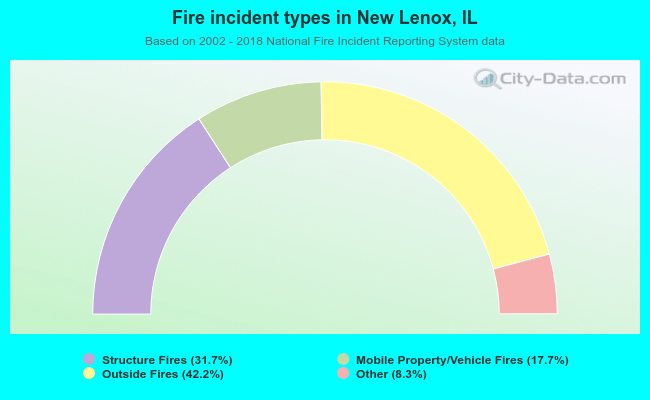 When looking into fire subcategories, the most reports belonged to: Outside Fires (42.2%), and Structure Fires (31.7%).