Homer Glen: Fire Incidents, Illinois (IL)
Where are fire incidents reported in Homer Glen, IL
Something went wrong! Please refresh the page.
| Fire incidents reported | |
|---|---|
| Sreet name | Count |
| 159TH ST | 96 |
| BELL RD | 88 |
| 151ST ST | 66 |
| PARKER RD | 50 |
| 143RD | 40 |
| CEDAR RD | 36 |
| 143RD ST | 28 |
| CRYSTAL LAKE DR | 28 |
| LARKSPUR CT | 28 |
| 167TH ST | 26 |
| BRUCE RD | 26 |
| 159TH | 24 |
| GOLDEN OAK DR | 22 |
| THORNWOOD LN | 22 |
| CODO DR | 18 |
| GOUGAR RD | 18 |
| PEBBLE CREEK DR | 18 |
| LEMONT RD | 16 |
| SHETLAND DR | 16 |
| KICKAPOO TRL | 14 |
| THORN APPLE DR | 14 |
| 147TH ST | 12 |
| 151ST | 12 |
| 179TH | 12 |
| ARCHER AVE | 12 |
| BADGER LN | 12 |
| HAAS RD | 12 |
| MARTINGALE LN | 12 |
| PHEASANT LN | 12 |
| 143RD DIST.2 ST | 10 |
| Other | 149 |
2004 - 2018 National Fire Incident Reporting System (NFIRS) incidents
- Incident types reported to NFIRS in Homer Glen, IL
- 6,74456.2%Rescue & EMS
- 1,79114.9%False Alarm
- 9688.1%Good Intent Call
- 9497.9%Fire
- 7816.5%Hazardous Condition
- 7616.3%Service Call
- Fire incident types reported to NFIRS in Homer Glen, IL
- 52955.7%Structure Fires
- 33735.5%Outside Fires
- 737.7%Mobile Property/Vehicle Fires
- 101.1%Other
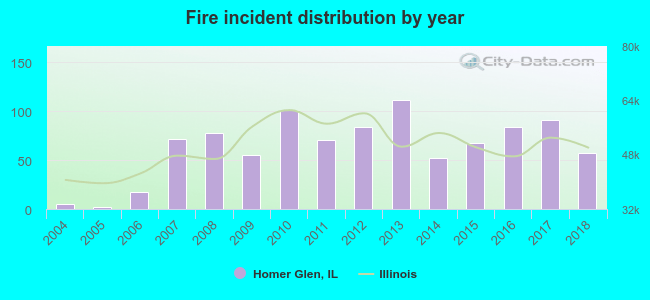 Based on the data from the years 2004 - 2018 the average number of fire incidents per year is 63. The highest number of fire incidents - 111 took place in 2013, and the least - 2 in 2005. The data has a rising trend.
The average number of yearly fire incidents per 10k residents in Homer Glen, IL compared to nearest cities:
(Note: Based on data for the last 3 years, including only cities with population 5,000 and above)
| Homer Glen: | 31.7 |
| Orland Park: | 22.6 |
| Orland Hills: | 24.7 |
| Lemont: | 40.6 |
| Mokena: | 44.2 |
| Lockport: | 43.1 |
| New Lenox: | 36.1 |
| Tinley Park: | 26.4 |
| Frankfort: | 46.4 |
 The median response time based on all reported fire incidents is 6 minutes. This is close to the Illinois median value.
The median response time in Homer Glen, IL compared to nearest cities:
(Note: Based on data for all years, including only cities with at least 500 fire incidents)
| Homer Glen: | 6 minutes |
| Orland Park: | 5 minutes |
| Lemont: | 7 minutes |
| Mokena: | 6 minutes |
| Lockport: | 5 minutes |
| New Lenox: | 6 minutes |
| Palos Park: | 5 minutes |
| Tinley Park: | 6 minutes |
| Frankfort: | 6 minutes |
 Based on the data from the years 2004 - 2018 the average number of fire-related yearly casualties is 1. The highest number of casualties - 3 took place in 2010, and the lowest - 0 in 2004. The data has an increasing trend.
The average number of injuries per 1,000 fires is 6. This indicator was the highest - 30 in 2010, and the lowest 0 in 2004. The trend for injuries per 1,000 incidents is growing. Compared to the Illinois value the number of injuries per 1,000 fires is lower.
Based on the data from the years 2004 - 2018 the average number of fire-related yearly casualties is 1. The highest number of casualties - 3 took place in 2010, and the lowest - 0 in 2004. The data has an increasing trend.
The average number of injuries per 1,000 fires is 6. This indicator was the highest - 30 in 2010, and the lowest 0 in 2004. The trend for injuries per 1,000 incidents is growing. Compared to the Illinois value the number of injuries per 1,000 fires is lower.Casualties per 1,000 incidents in Homer Glen, IL compared to nearest cities:
(Note: Based on data for all years, including only cities with at least 500 fire incidents)
| Homer Glen: | 8.4 |
| Orland Park: | 12.9 |
| Lemont: | 8.4 |
| Mokena: | 3.4 |
| Lockport: | 16.0 |
| New Lenox: | 3.6 |
| Palos Park: | 1.9 |
| Tinley Park: | 4.7 |
| Frankfort: | 6.0 |
 33.7% incidents where reported in the morning and 66.3% in the evening. The most fires (16.6%) took place on Saturday, and the least (11.4%) on Tuesday.
 According to the 949 fire incidents from years 2004 - 2018 most fires (14.3%) took place during November, and the least (4.4%) in September.
 Out of all 12,010 cases reported during the years 2004 - 2018, the most belonged to the categories: Rescue & EMS (56.2%), False Alarm (14.9%), and Good Intent Call (8.1%).
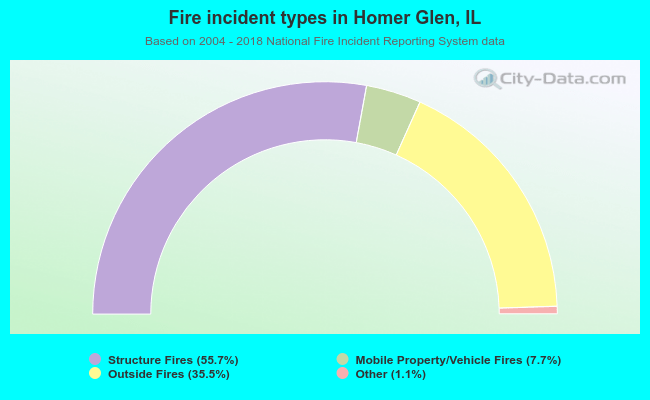 When looking into fire subcategories, the most reports belonged to: Structure Fires (55.7%), and Outside Fires (35.5%).