Mokena: Fire Incidents, Illinois (IL)
Where are fire incidents reported in Mokena, IL
Something went wrong! Please refresh the page.
|
| |||||||||||||||||||||||||||||||||||||||||||||||||||||||||||||||||||||||||||||||||||||||||||||||||||||||||||||
2002 - 2018 National Fire Incident Reporting System (NFIRS) incidents
- Incident types reported to NFIRS in Mokena, IL
- 6,39348.8%Rescue & EMS
- 2,28317.4%False Alarm
- 1,46211.2%Good Intent Call
- 1,2919.9%Service Call
- 8866.8%Fire
- 7495.7%Hazardous Condition
- Fire incident types reported to NFIRS in Mokena, IL
- 36240.9%Structure Fires
- 36040.6%Outside Fires
- 14616.5%Mobile Property/Vehicle Fires
- 182.0%Other
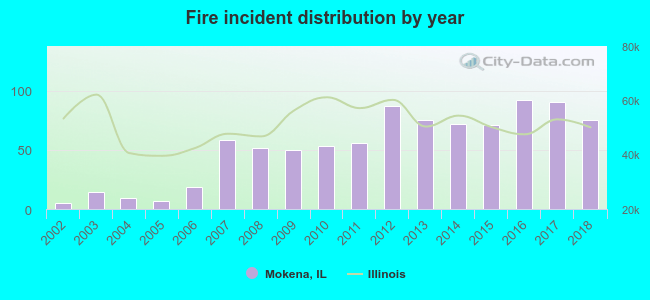 Based on the data from the years 2002 - 2018 the average number of fires per year is 52. The highest number of reported fires - 92 took place in 2016, and the least - 5 in 2002. The data has a growing trend.
The average number of yearly fire incidents per 10k residents in Mokena, IL compared to nearest cities:
(Note: Based on data for the last 3 years, including only cities with population 5,000 and above)
| Mokena: | 44.2 |
| Frankfort: | 46.4 |
| Orland Hills: | 24.7 |
| Tinley Park: | 26.4 |
| New Lenox: | 36.1 |
| Orland Park: | 22.6 |
| Homer Glen: | 31.7 |
| Matteson: | 55.2 |
| Oak Forest: | 31.2 |
 The median response time based on all reported fire incidents is 6 minutes. This is similar to the state median value.
The median response time in Mokena, IL compared to nearest cities:
(Note: Based on data for all years, including only cities with at least 500 fire incidents)
| Mokena: | 6 minutes |
| Frankfort: | 6 minutes |
| Tinley Park: | 6 minutes |
| New Lenox: | 6 minutes |
| Orland Park: | 5 minutes |
| Homer Glen: | 6 minutes |
| Matteson: | 6 minutes |
| Oak Forest: | 5 minutes |
| Country Club Hills: | 5 minutes |
 29.0% incidents where reported in the morning and 71.0% in the evening. The most fires (19.0%) took place on Saturday, and the least (11.6%) on Tuesday.
 According to the 886 incident reports from years 2002 - 2018 most fires (11.4%) took place during July, and the least (5.9%) in February.
 Out of all 13,089 cases reported during the years 2002 - 2018, the most belonged to the categories: Rescue & EMS (48.8%), False Alarm (17.4%), and Good Intent Call (11.2%).
 When looking into fire subcategories, the most reports belonged to: Structure Fires (40.9%), and Outside Fires (40.6%).