Orland Hills: Fire Incidents, Illinois (IL)
Where are fire incidents reported in Orland Hills, IL
Something went wrong! Please refresh the page.
|
| |||||||||||||||||||||||||||||||||||||||||||||||||||||||||||||||||||||||||||||||||||||||||||||||||||||||||||||
2003 - 2018 National Fire Incident Reporting System (NFIRS) incidents
- Incident types reported to NFIRS in Orland Hills, IL
- 1,71263.0%Rescue & EMS
- 31911.7%False Alarm
- 2529.3%Hazardous Condition
- 1856.8%Fire
- 1776.5%Service Call
- 712.6%Good Intent Call
- Fire incident types reported to NFIRS in Orland Hills, IL
- 10757.8%Structure Fires
- 5831.4%Outside Fires
- 1910.3%Mobile Property/Vehicle Fires
- 10.5%Other
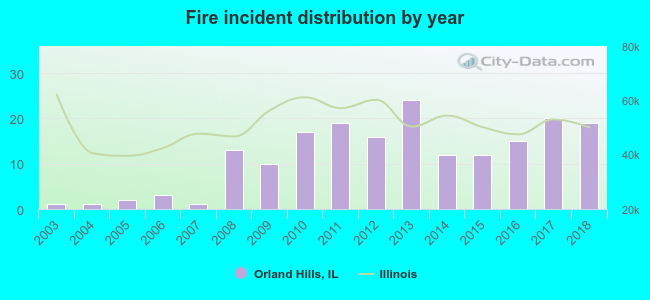 According to the data from the years 2003 - 2018 the average number of fire incidents per year is 12. The highest number of reported fire incidents - 24 took place in 2013, and the least - 1 in 2003. The data has a growing trend.
The average number of yearly fire incidents per 10k residents in Orland Hills, IL compared to nearest cities:
(Note: Based on data for the last 3 years, including only cities with population 5,000 and above)
| Orland Hills: | 24.7 |
| Orland Park: | 22.6 |
| Tinley Park: | 26.4 |
| Mokena: | 44.2 |
| Oak Forest: | 31.2 |
| Homer Glen: | 31.7 |
| Palos Heights: | 34.7 |
| Frankfort: | 46.4 |
| Crestwood: | 51.7 |

 Based on the data from the years 2003 - 2018 the average number of fire-related casualties per year is 0. The highest number of reported casualties - 2 took place in 2012, and the lowest - 0 in 2003. The data has an increasing trend.
 22.2% incidents where reported in the morning and 77.8% in the evening. The most fires (19.5%) took place on Monday, and the least (9.2%) on Thursday.
 According to the 185 fire incidents from years 2003 - 2018 most fires (15.1%) took place during July, and the least (3.8%) in November.
 Out of all 2,719 cases reported during the years 2003 - 2018, the most belonged to the categories: Rescue & EMS (63.0%), False Alarm (11.7%), and Hazardous Condition (9.3%).
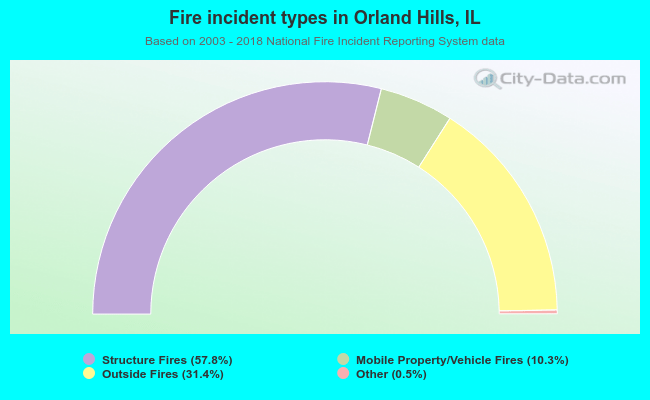 When looking into fire subcategories, the most reports belonged to: Structure Fires (57.8%), and Outside Fires (31.4%).