Oak Park: Fire Incidents, Michigan (MI)
Where are fire incidents reported in Oak Park, MI
Something went wrong! Please refresh the page.
| Fire incidents reported | |
|---|---|
| Sreet name | Count |
| COOLIDGE HWY | 108 |
| NINE MILE RD | 92 |
| GREENFIELD RD | 88 |
| KIPLING AVE | 66 |
| LINCOLN DR | 60 |
| RENSSELAER AVE | 56 |
| TEN MILE RD | 56 |
| NORTHGATE BLVD | 50 |
| WESTHAMPTON AVE | 48 |
| GARDNER AVE | 46 |
| STRATFORD AVE | 46 |
| KENOSHA AVE | 44 |
| STRATFORD CT | 44 |
| CLOVERLAWN AVE | 40 |
| NINEMILE RD | 40 |
| KENWOOD AVE | 36 |
| MARLOW AVE | 36 |
| MILLER ST | 36 |
| ROSEWOOD AVE | 36 |
| AVON AVE | 34 |
| HARDING AVE | 34 |
| EIGHT MILE RD | 32 |
| JAMES ST | 32 |
| ALBANY AVE | 30 |
| GREENFIELD | 30 |
| OAK PARK BLVD | 30 |
| PARKLAWN AVE | 30 |
| BEVERLY AVE | 28 |
| CHURCH ST | 28 |
| LINCOLN | 28 |
| Other | 163 |
2002 - 2018 National Fire Incident Reporting System (NFIRS) incidents
- Incident types reported to NFIRS in Oak Park, MI
- 2,59241.7%Rescue & EMS
- 1,52724.6%Fire
- 73611.8%Hazardous Condition
- 6139.9%False Alarm
- 4707.6%Good Intent Call
- 2614.2%Service Call
- 80.1%Overpressure Rupture
- 70.1%Special Incident
- Fire incident types reported to NFIRS in Oak Park, MI
- 92760.7%Structure Fires
- 29919.6%Mobile Property/Vehicle Fires
- 26417.3%Outside Fires
- 372.4%Other
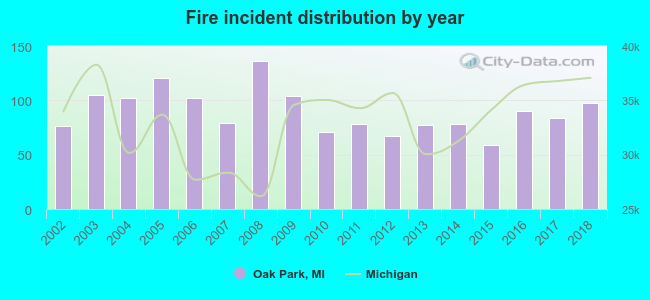 Based on the data from the years 2002 - 2018 the average number of fires per year is 90. The highest number of fire incidents - 136 took place in 2008, and the least - 59 in 2015. The data has an increasing trend.
The average number of yearly fire incidents per 10k residents in Oak Park, MI compared to nearest cities:
(Note: Based on data for the last 3 years, including only cities with population 5,000 and above)
| Oak Park: | 30.4 |
| Huntington Woods: | 15.2 |
| Berkley: | 19.4 |
| Ferndale: | 32.1 |
| Royal Oak: | 15.8 |
| Southfield: | 30.5 |
| Hazel Park: | 35.3 |
| Madison Heights: | 39.0 |
| Beverly Hills: | 23.9 |
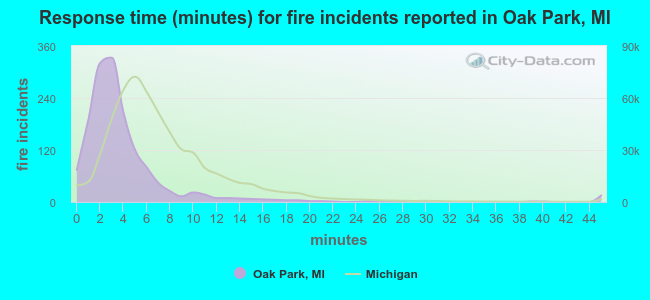 The median response time based on all reported fire incidents is 3 minutes. This is much lower compared to the state median value.
The median response time in Oak Park, MI compared to nearest cities:
(Note: Based on data for all years, including only cities with at least 500 fire incidents)
| Oak Park: | 3 minutes |
| Ferndale: | 4 minutes |
| Royal Oak: | 6 minutes |
| Southfield: | 5 minutes |
| Hazel Park: | 4 minutes |
| Madison Heights: | 3 minutes |
| Highland Park: | 4 minutes |
| Detroit: | 6 minutes |
| Hamtramck: | 3 minutes |
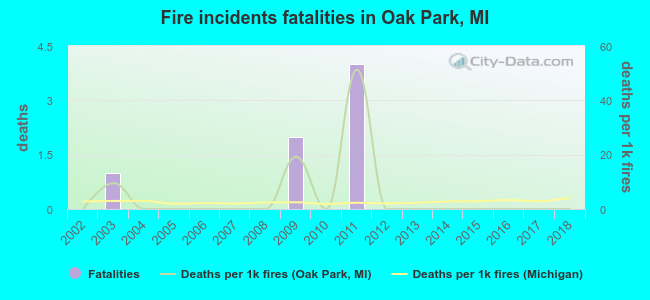 According to the reports from the years 2002 - 2018 the average number of fire-related fatalities per year is 0. The highest number of deaths - 4 took place in 2011, and the lowest - 0 in 2002. The data has a constant trend.
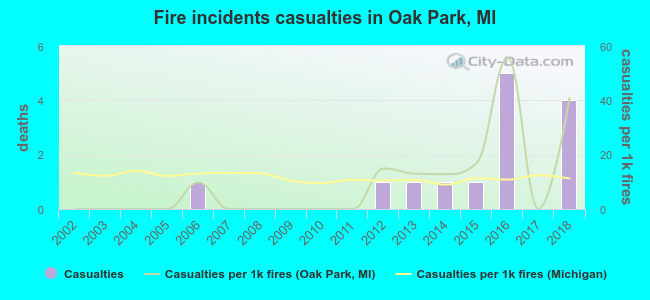 According to the data from the years 2002 - 2018 the average number of fire-related casualties per year is 1. The highest number of reported injuries - 5 took place in 2016, and the lowest - 0 in 2002. The data has an increasing trend.
The average number of casualties per 1,000 fire incidents is 10. This indicator was the highest - 56 in 2016, and the lowest 0 in 2002. The trend for casualties per 1,000 fires is growing. Compared to the Michigan value the number of injuries per 1,000 fires is lower.
According to the data from the years 2002 - 2018 the average number of fire-related casualties per year is 1. The highest number of reported injuries - 5 took place in 2016, and the lowest - 0 in 2002. The data has an increasing trend.
The average number of casualties per 1,000 fire incidents is 10. This indicator was the highest - 56 in 2016, and the lowest 0 in 2002. The trend for casualties per 1,000 fires is growing. Compared to the Michigan value the number of injuries per 1,000 fires is lower.Casualties per 1,000 incidents in Oak Park, MI compared to nearest cities:
(Note: Based on data for all years, including only cities with at least 500 fire incidents)
| Oak Park: | 9.2 |
| Ferndale: | 33.1 |
| Royal Oak: | 24.1 |
| Southfield: | 14.3 |
| Hazel Park: | 21.9 |
| Madison Heights: | 10.5 |
| Highland Park: | 3.4 |
| Detroit: | 6.5 |
| Hamtramck: | 2.4 |
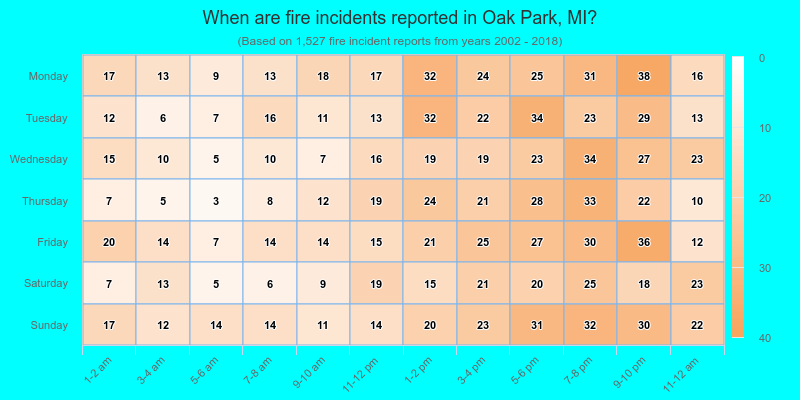
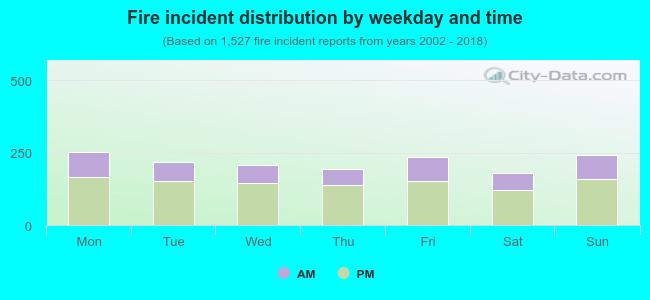 32.4% incidents where reported in the morning and 67.6% in the evening. The most fires (16.6%) took place on Monday, and the least (11.9%) on Saturday.
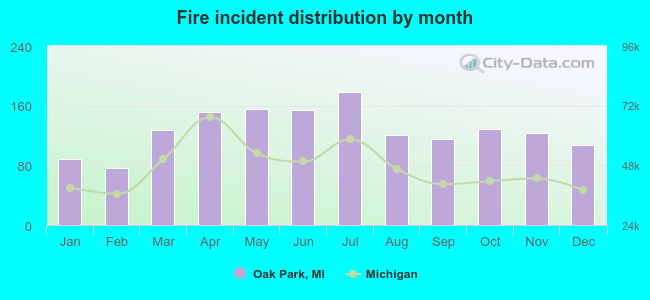 Based on the 1,527 incident reports from years 2002 - 2018 most fires (11.7%) took place during July, and the least (5.0%) in February.
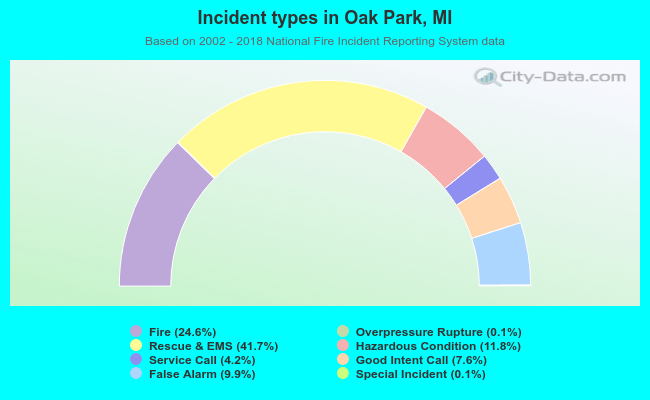 Out of all 6,214 cases reported during the years 2002 - 2018, the most belonged to the categories: Rescue & EMS (41.7%), Fire (24.6%), and Hazardous Condition (11.8%).
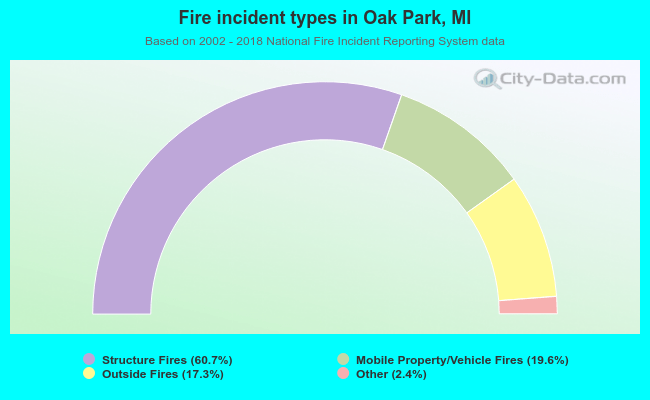 When looking into fire subcategories, the most reports belonged to: Structure Fires (60.7%), and Mobile Property/Vehicle Fires (19.6%).