Berkley: Fire Incidents, Michigan (MI)
Where are fire incidents reported in Berkley, MI
Something went wrong! Please refresh the page.
|
| |||||||||||||||||||||||||||||||||||||||||||||||||||||||||||||||||||||||||||||||||||||||||||||||||||||||||||||
2002 - 2018 National Fire Incident Reporting System (NFIRS) incidents
- Incident types reported to NFIRS in Berkley, MI
- 73734.9%Rescue & EMS
- 52524.9%Hazardous Condition
- 39118.5%Fire
- 1788.4%False Alarm
- 1396.6%Service Call
- 1376.5%Good Intent Call
- Fire incident types reported to NFIRS in Berkley, MI
- 22657.8%Structure Fires
- 6416.4%Mobile Property/Vehicle Fires
- 6416.4%Outside Fires
- 379.5%Other
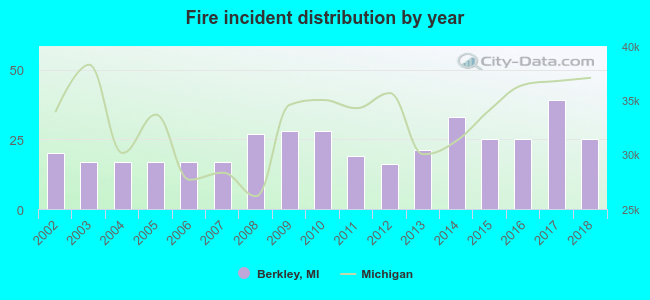 Based on the data from the years 2002 - 2018 the average number of fire incidents per year is 23. The highest number of reported fire incidents - 39 took place in 2017, and the least - 16 in 2012. The data has an increasing trend.
The average number of yearly fire incidents per 10k residents in Berkley, MI compared to nearest cities:
(Note: Based on data for the last 3 years, including only cities with population 5,000 and above)
| Berkley: | 19.4 |
| Huntington Woods: | 15.2 |
| Royal Oak: | 15.8 |
| Oak Park: | 30.4 |
| Beverly Hills: | 23.9 |
| Clawson: | 16.0 |
| Southfield: | 30.5 |
| Birmingham: | 15.9 |
| Ferndale: | 32.1 |
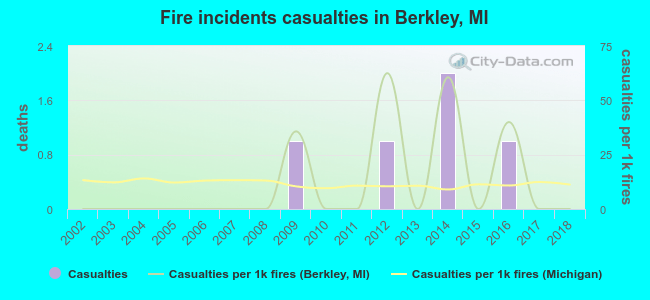 According to the reports from the years 2002 - 2018 the average number of fire-related casualties per year is 0. The highest number of reported casualties - 2 took place in 2014, and the lowest - 0 in 2002. The data has a constant trend.
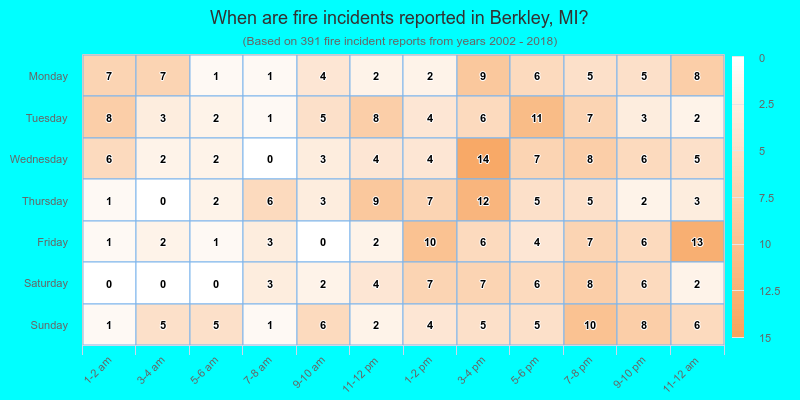
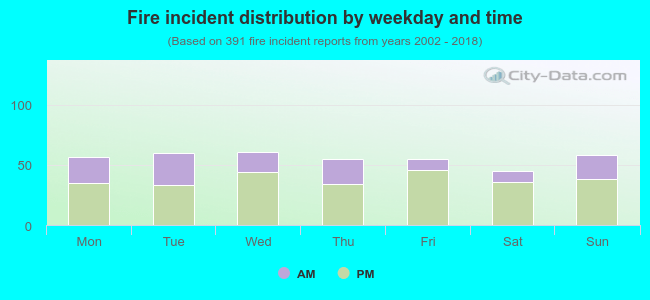 32.0% incidents where reported in the morning and 68.0% in the evening. The most fires (15.6%) took place on Wednesday, and the least (11.5%) on Saturday.
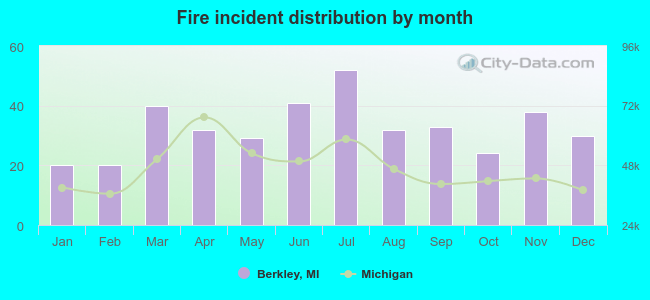 Based on the 391 incident reports from years 2002 - 2018 most fires (13.3%) took place during July, and the least (5.1%) in January.
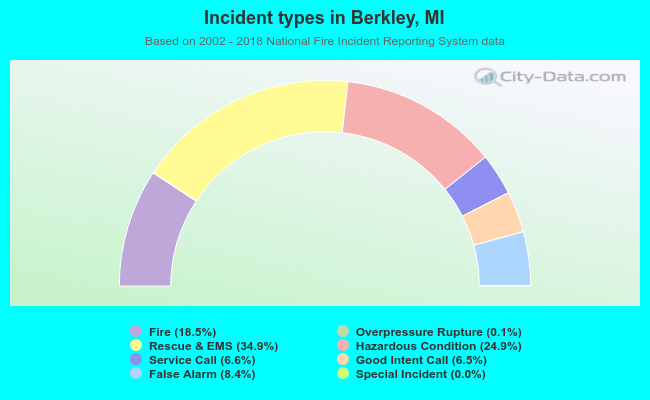 Out of all 2,110 cases reported during the years 2002 - 2018, the most belonged to the categories: Rescue & EMS (34.9%), Hazardous Condition (24.9%), and Fire (18.5%).
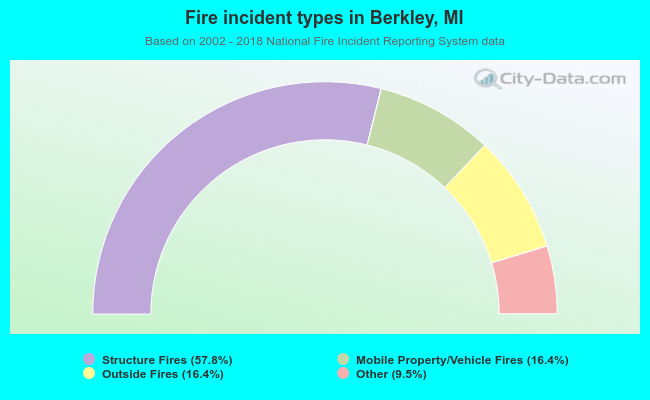 When looking into fire subcategories, the most incidents belonged to: Structure Fires (57.8%), and Mobile Property/Vehicle Fires (16.4%).