Beverly Hills: Fire Incidents, Michigan (MI)
Where are fire incidents reported in Beverly Hills, MI
Something went wrong! Please refresh the page.
|
| |||||||||||||||||||||||||||||||||||||||||||||||||||||||||||||||||||||||||||||||||||||||||||||||||||||||||||||
2002 - 2018 National Fire Incident Reporting System (NFIRS) incidents
- Incident types reported to NFIRS in Beverly Hills, MI
- 1,49541.6%Rescue & EMS
- 86924.2%Hazardous Condition
- 3329.2%False Alarm
- 3058.5%Fire
- 2677.4%Special Incident
- 1825.1%Good Intent Call
- 1434.0%Service Call
- 40.1%Overpressure Rupture
- Fire incident types reported to NFIRS in Beverly Hills, MI
- 18360.0%Structure Fires
- 5016.4%Other
- 4916.1%Outside Fires
- 237.5%Mobile Property/Vehicle Fires
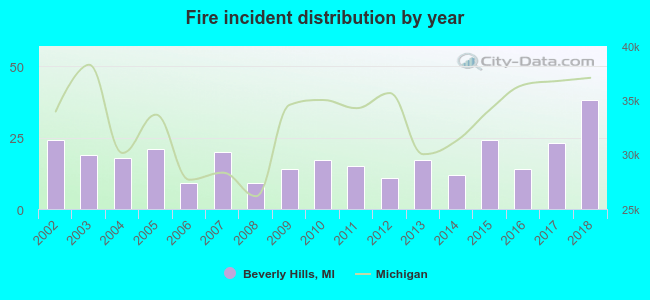 Based on the data from the years 2002 - 2018 the average number of fires per year is 18. The highest number of fire incidents - 38 took place in 2018, and the least - 9 in 2006. The data has a rising trend.
The average number of yearly fire incidents per 10k residents in Beverly Hills, MI compared to nearest cities:
(Note: Based on data for the last 3 years, including only cities with population 5,000 and above)
| Beverly Hills: | 23.9 |
| Birmingham: | 15.9 |
| Berkley: | 19.4 |
| Southfield: | 30.5 |
| Bloomfield Township: | 0.2 |
| Clawson: | 16.0 |
| Huntington Woods: | 15.2 |
| Royal Oak: | 15.8 |
| Oak Park: | 30.4 |
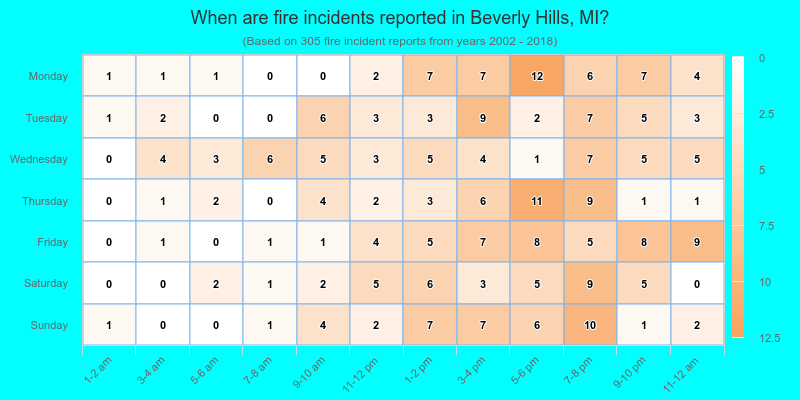
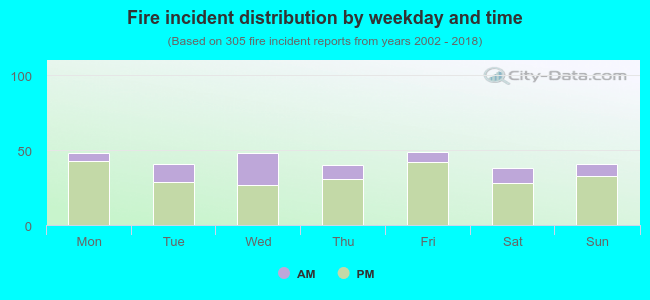 23.6% incidents where reported in the morning and 76.4% in the evening. The most fires (16.1%) took place on Friday, and the least (12.5%) on Saturday.
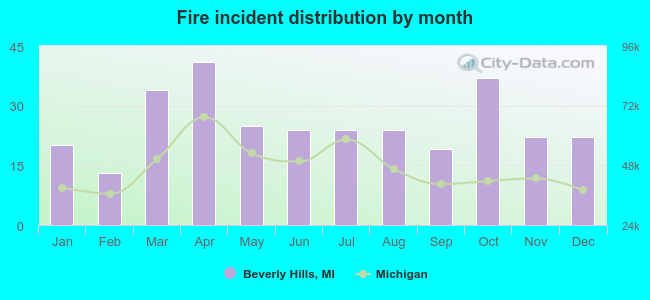 According to the 305 fire incidents from years 2002 - 2018 most fires (13.4%) took place during April, and the least (4.3%) in February.
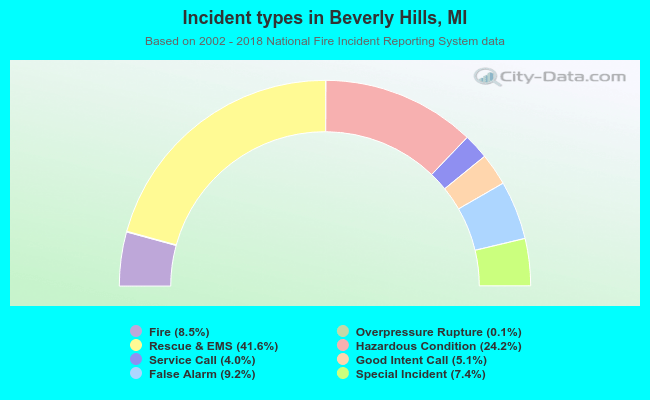 Out of all 3,597 cases reported during the years 2002 - 2018, the most belonged to the categories: Rescue & EMS (41.6%), Hazardous Condition (24.2%), and False Alarm (9.2%).
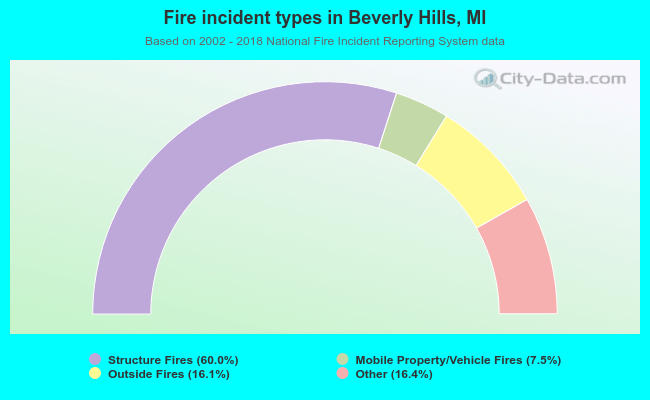 When looking into fire subcategories, the most reports belonged to: Structure Fires (60.0%), and Other (16.4%).