Oceanside: Fire Incidents, New York (NY)
Where are fire incidents reported in Oceanside, NY
Something went wrong! Please refresh the page.
| Fire incidents reported | |
|---|---|
| Sreet name | Count |
| LONG BEACH RD | 94 |
| LONG BEACH RD | 48 |
| LAWSON BLVD | 32 |
| ATLANTIC AVE | 28 |
| HAMPTON RD | 26 |
| DALY BLVD | 20 |
| OCEANSIDE RD | 20 |
| FOXHURST ROAD | 18 |
| TERRELL AVE | 18 |
| WEIDNER AVE | 18 |
| FOXHURST RD | 16 |
| HAMPTON RD | 16 |
| ROYAL AVE | 16 |
| CARREL BLVD | 14 |
| DALY BLVD | 14 |
| OCEANSIDE RD | 14 |
| ATLANTIC AVE | 12 |
| BROWER AVE | 12 |
| WAUKENA AVE | 12 |
| WAUKENA AVE | 12 |
| FULTON AVE | 10 |
| GREENTREE DR | 10 |
| MAHLON BROWER DR | 10 |
| NEW ST | 10 |
| AMOS AVE | 8 |
| FREDERICK ST | 8 |
| KENNETH PL | 8 |
| LAWSON BLVD | 8 |
| MURDOCK AVE | 8 |
| ONE HEALTHY WAY | 8 |
| Other | 78 |
2006 - 2018 National Fire Incident Reporting System (NFIRS) incidents
- Incident types reported to NFIRS in Oceanside, NY
- 4,21048.0%Rescue & EMS
- 1,62818.6%False Alarm
- 1,28314.6%Hazardous Condition
- 7488.5%Good Intent Call
- 6267.1%Fire
- 2482.8%Service Call
- 90.1%Severe Weather
- Fire incident types reported to NFIRS in Oceanside, NY
- 29246.6%Structure Fires
- 23136.9%Outside Fires
- 6710.7%Mobile Property/Vehicle Fires
- 365.8%Other
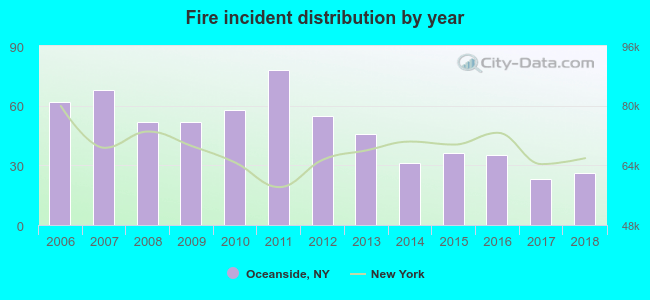 According to the data from the years 2006 - 2018 the average number of fire incidents per year is 48. The highest number of reported fires - 78 took place in 2011, and the least - 23 in 2017. The data has a decreasing trend.
The average number of yearly fire incidents per 10k residents in Oceanside, NY compared to nearest cities:
(Note: Based on data for the last 3 years, including only cities with population 5,000 and above)
| Oceanside: | 8.7 |
| East Rockaway: | 1.5 |
| Rockville Centre: | 19.6 |
| Baldwin: | 29.4 |
| Lynbrook: | 6.6 |
| Lakeview: | 6.5 |
| Freeport: | 20.8 |
| Hewlett: | 12.7 |
| Malverne: | 6.2 |
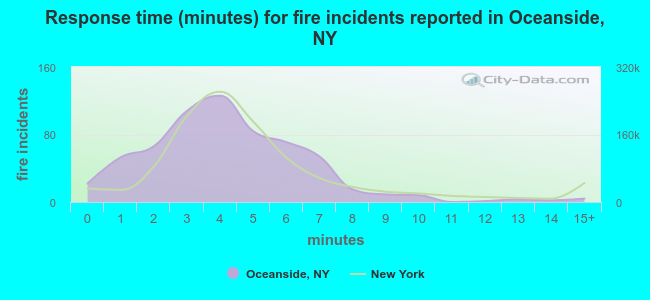 The median response time based on all reported fire incidents is 4 minutes. This is about the same as the New York median value.
The median response time in Oceanside, NY compared to nearest cities:
(Note: Based on data for all years, including only cities with at least 500 fire incidents)
| Oceanside: | 4 minutes |
| Baldwin: | 4 minutes |
| Lynbrook: | 3 minutes |
| Freeport: | 3 minutes |
| Long Beach: | 4 minutes |
| Valley Stream: | 4 minutes |
| West Hempstead: | 0 minutes |
| Hempstead: | 3 minutes |
| Franklin Square: | 4 minutes |
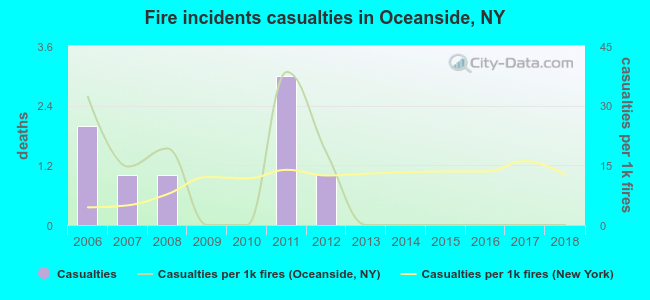 Based on the reports from the years 2006 - 2018 the average number of fire-related casualties per year is 1. The highest number of injuries - 3 took place in 2011, and the lowest - 0 in 2009. The data has a declining trend.
The average number of casualties per 1,000 fires is 9. This indicator was the highest - 38 in 2011, and the lowest 0 in 2009. The trend for casualties per 1,000 incidents is dropping. Compared to the New York value the number of injuries per 1,000 incidents is higher.
Based on the reports from the years 2006 - 2018 the average number of fire-related casualties per year is 1. The highest number of injuries - 3 took place in 2011, and the lowest - 0 in 2009. The data has a declining trend.
The average number of casualties per 1,000 fires is 9. This indicator was the highest - 38 in 2011, and the lowest 0 in 2009. The trend for casualties per 1,000 incidents is dropping. Compared to the New York value the number of injuries per 1,000 incidents is higher.Casualties per 1,000 incidents in Oceanside, NY compared to nearest cities:
(Note: Based on data for all years, including only cities with at least 500 fire incidents)
| Oceanside: | 12.8 |
| Baldwin: | 1.2 |
| Lynbrook: | 43.6 |
| Freeport: | 46.4 |
| Long Beach: | 8.6 |
| Valley Stream: | 10.0 |
| West Hempstead: | 0.0 |
| Hempstead: | 21.2 |
| Franklin Square: | 9.7 |
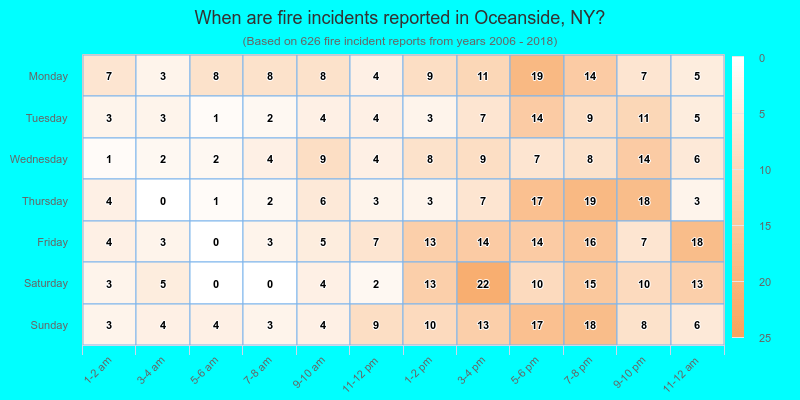
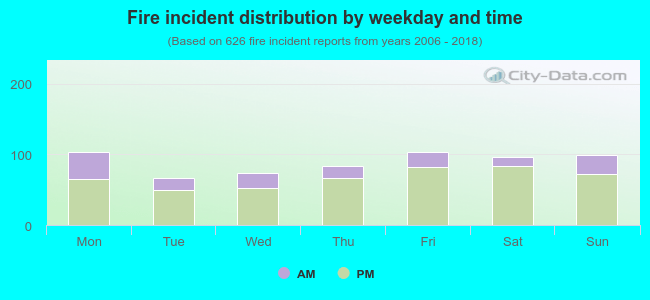 24.9% incidents where reported in the morning and 75.1% in the evening. The most fires (16.6%) took place on Friday, and the least (10.5%) on Tuesday.
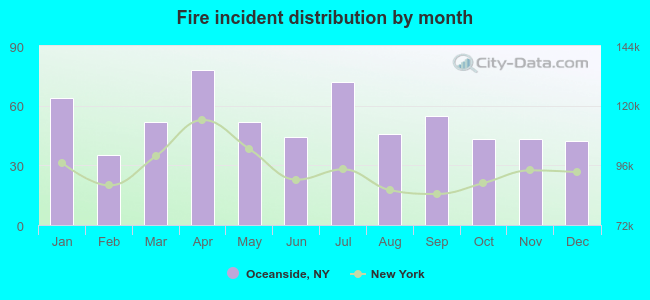 According to the 626 fires from years 2006 - 2018 most fires (12.5%) took place during April, and the least (5.6%) in February.
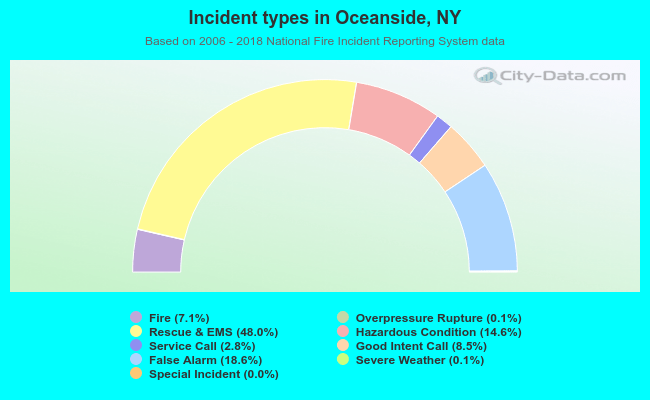 Out of all 8,763 cases reported during the years 2006 - 2018, the most belonged to the categories: Rescue & EMS (48.0%), False Alarm (18.6%), and Hazardous Condition (14.6%).
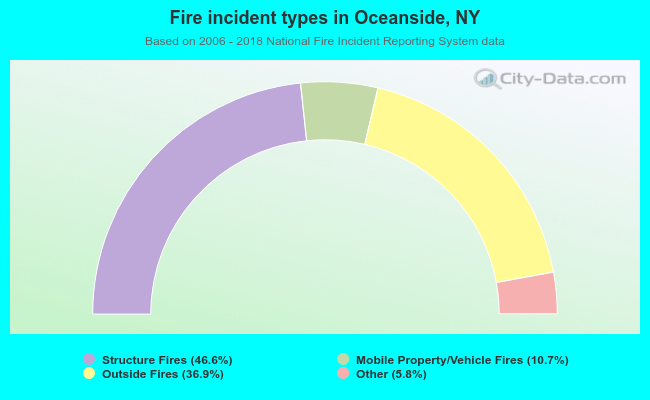 When looking into fire subcategories, the most incidents belonged to: Structure Fires (46.6%), and Outside Fires (36.9%).