Tinley Park: Fire Incidents, Illinois (IL)
Where are fire incidents reported in Tinley Park, IL
Something went wrong! Please refresh the page.
| Fire incidents reported | |
|---|---|
| Sreet name | Count |
| HARLEM AVE | 312 |
| 183RD ST | 124 |
| OAK PARK AVE | 110 |
| 80TH AVE | 102 |
| 167TH ST | 82 |
| I80 HWY | 82 |
| 175TH ST | 80 |
| CENTRAL AVE | 66 |
| 159TH ST | 64 |
| 171ST ST | 62 |
| 191ST ST | 58 |
| 183RD | 54 |
| 66TH CT | 52 |
| I80 | 46 |
| RIDGELAND AVE | 44 |
| 159TH | 40 |
| 171ST | 40 |
| 175TH | 38 |
| OAK FOREST AVE | 38 |
| 191ST | 36 |
| 174TH ST | 32 |
| FLOSSMOOR RD | 32 |
| 167TH | 30 |
| SAYRE AVE | 28 |
| 160TH PL | 26 |
| 163RD PL | 26 |
| 179TH ST | 26 |
| 71ST CT | 26 |
| 163RD | 24 |
| 163RD ST | 24 |
| Other | 323 |
2002 - 2018 National Fire Incident Reporting System (NFIRS) incidents
- Incident types reported to NFIRS in Tinley Park, IL
- 3,50124.9%Rescue & EMS
- 3,10722.1%False Alarm
- 2,89320.6%Hazardous Condition
- 2,12715.1%Fire
- 1,48210.5%Good Intent Call
- 8886.3%Service Call
- 300.2%Overpressure Rupture
- 300.2%Severe Weather
- Fire incident types reported to NFIRS in Tinley Park, IL
- 89742.2%Structure Fires
- 78436.9%Outside Fires
- 35616.7%Mobile Property/Vehicle Fires
- 904.2%Other
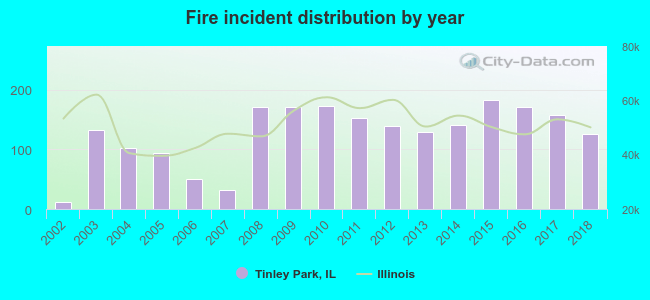 Based on the data from the years 2002 - 2018 the average number of fire incidents per year is 125. The highest number of reported fire incidents - 182 took place in 2015, and the least - 11 in 2002. The data has an increasing trend.
The average number of yearly fire incidents per 10k residents in Tinley Park, IL compared to nearest cities:
(Note: Based on data for the last 3 years, including only cities with population 5,000 and above)
| Tinley Park: | 26.4 |
| Orland Hills: | 24.7 |
| Oak Forest: | 31.2 |
| Orland Park: | 22.6 |
| Country Club Hills: | 63.0 |
| Mokena: | 44.2 |
| Matteson: | 55.2 |
| Midlothian: | 59.0 |
| Frankfort: | 46.4 |
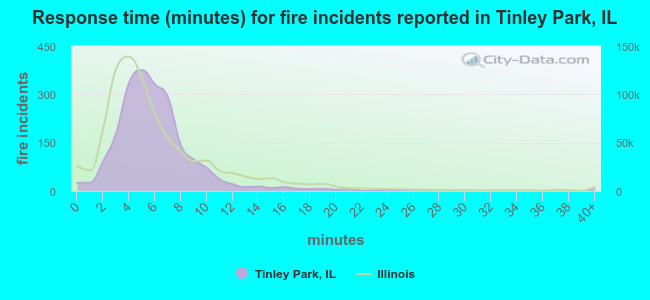 The median response time based on all reported fire incidents is 6 minutes. This is comparable to the Illinois median value.
The median response time in Tinley Park, IL compared to nearest cities:
(Note: Based on data for all years, including only cities with at least 500 fire incidents)
| Tinley Park: | 6 minutes |
| Oak Forest: | 5 minutes |
| Orland Park: | 5 minutes |
| Country Club Hills: | 5 minutes |
| Mokena: | 6 minutes |
| Matteson: | 6 minutes |
| Midlothian: | 4 minutes |
| Frankfort: | 6 minutes |
| Crestwood: | 4 minutes |
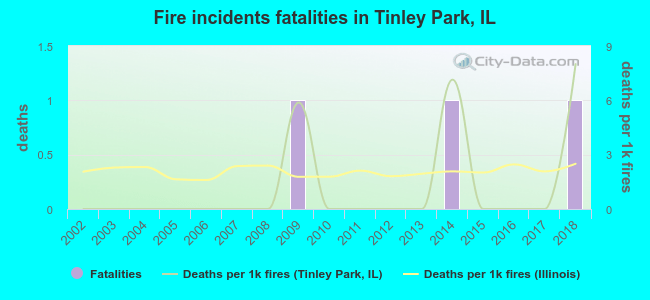 Based on the reports from the years 2002 - 2018 the average number of fire-related fatalities per year is 0. The highest number of reported deaths - 1 took place in 2009, and the lowest - 0 in 2002. The data has an increasing trend.
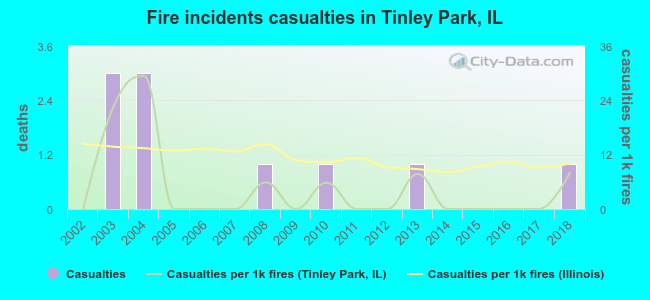 Based on the data from the years 2002 - 2018 the average number of fire-related casualties per year is 1. The highest number of reported casualties - 3 took place in 2003, and the lowest - 0 in 2002. The data has an increasing trend.
The average number of casualties per 1,000 fires is 5. This indicator was the highest - 29 in 2004, and the lowest 0 in 2002. The trend for casualties per 1,000 fire incidents is growing. Compared to the state value the number of injuries per 1,000 incidents is much lower.
Based on the data from the years 2002 - 2018 the average number of fire-related casualties per year is 1. The highest number of reported casualties - 3 took place in 2003, and the lowest - 0 in 2002. The data has an increasing trend.
The average number of casualties per 1,000 fires is 5. This indicator was the highest - 29 in 2004, and the lowest 0 in 2002. The trend for casualties per 1,000 fire incidents is growing. Compared to the state value the number of injuries per 1,000 incidents is much lower.Casualties per 1,000 incidents in Tinley Park, IL compared to nearest cities:
(Note: Based on data for all years, including only cities with at least 500 fire incidents)
| Tinley Park: | 4.7 |
| Oak Forest: | 11.3 |
| Orland Park: | 12.9 |
| Country Club Hills: | 6.0 |
| Mokena: | 3.4 |
| Matteson: | 21.6 |
| Midlothian: | 29.2 |
| Frankfort: | 6.0 |
| Crestwood: | 64.6 |
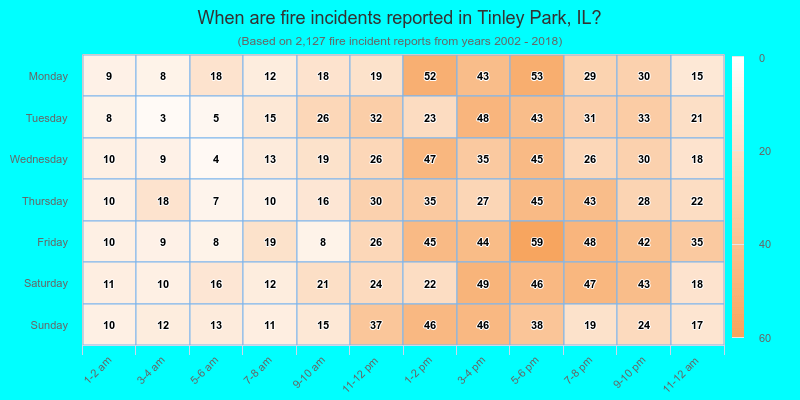
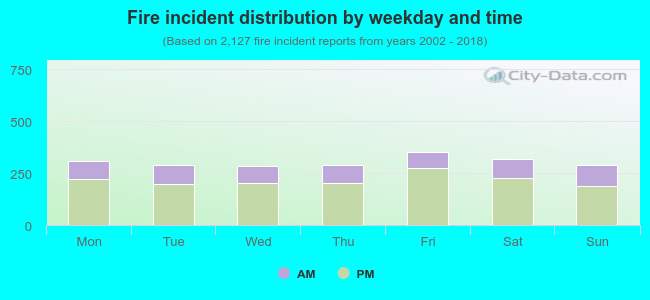 29.0% incidents where reported in the morning and 71.0% in the evening. The most fires (16.6%) took place on Friday, and the least (13.3%) on Wednesday.
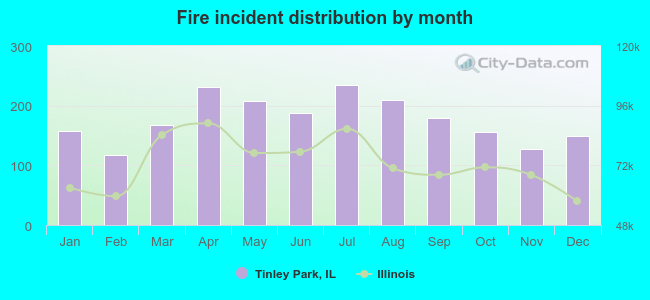 According to the 2,127 reports from years 2002 - 2018 most fires (11.0%) took place during July, and the least (5.5%) in February.
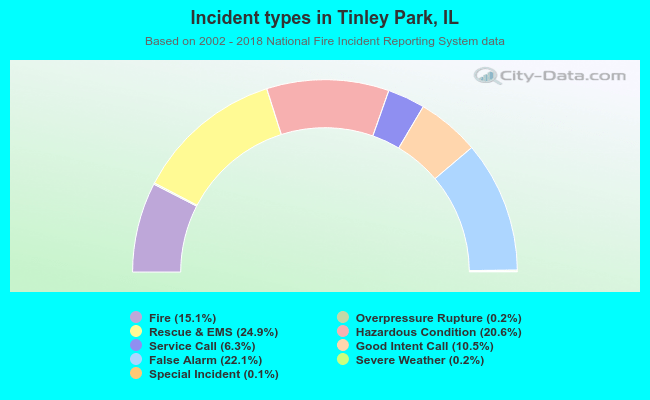 Out of all 14,070 cases reported during the years 2002 - 2018, the most belonged to the categories: Rescue & EMS (24.9%), False Alarm (22.1%), and Hazardous Condition (20.6%).
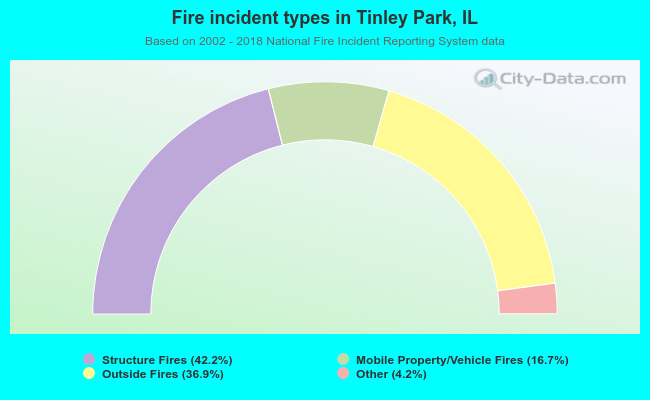 When looking into fire subcategories, the most reports belonged to: Structure Fires (42.2%), and Outside Fires (36.9%).