Palm Coast: Fire Incidents, Florida (FL)
Where are fire incidents reported in Palm Coast, FL
Something went wrong! Please refresh the page.
| Fire incidents reported | |
|---|---|
| Sreet name | Count |
| PALM COAST PKY | 238 |
| BELLE TERRE PKY | 166 |
| I95 HWY | 146 |
| OLD KINGS RD | 108 |
| OCEAN SHORE BLVD | 94 |
| - | 76 |
| CYPRESS POINT PKY | 66 |
| I-95 | 62 |
| PINE LAKES PKY | 60 |
| I-95 HWY | 48 |
| 95 | 46 |
| US1 HWY | 46 |
| PALM HARBOR PKY | 38 |
| 100 | 34 |
| FLAGLER PLAZA DR | 34 |
| AIRPORT | 30 |
| OCEAN CREST DR | 30 |
| PARKVIEW DR | 28 |
| RYMFIRE DR | 28 |
| LAKEVIEW BLVD | 26 |
| FLORIDA PARK DR | 24 |
| BEECHWOOD LN | 22 |
| BOULDER ROCK DR | 22 |
| SEMINOLE WOODS | 22 |
| SEMINOLE WOODS BLVD | 22 |
| CORAL REEF CT | 20 |
| CYPRESS EDGE DR | 20 |
| LONDON DR | 20 |
| OTIS STONE HUNTER RD | 20 |
| PRITCHARD DR | 20 |
| Other | 1,968 |
2003 - 2018 National Fire Incident Reporting System (NFIRS) incidents
- Incident types reported to NFIRS in Palm Coast, FL
- 50,48960.7%Rescue & EMS
- 11,43713.7%Service Call
- 10,90513.1%Good Intent Call
- 3,5844.3%Fire
- 3,0433.7%False Alarm
- 2,8733.5%Hazardous Condition
- 7640.9%Special Incident
- Fire incident types reported to NFIRS in Palm Coast, FL
- 1,92453.7%Outside Fires
- 93626.1%Structure Fires
- 61817.2%Mobile Property/Vehicle Fires
- 1063.0%Other
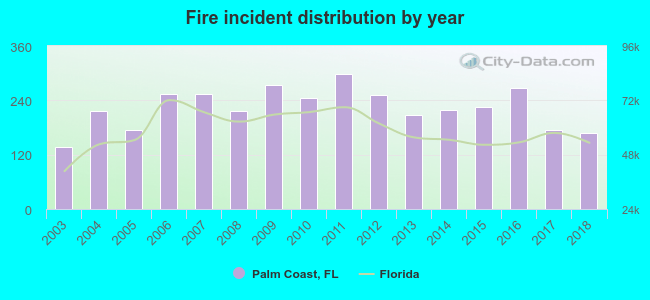 According to the data from the years 2003 - 2018 the average number of fires per year is 224. The highest number of fire incidents - 299 took place in 2011, and the least - 138 in 2003. The data has an increasing trend.
The average number of yearly fire incidents per 10k residents in Palm Coast, FL compared to nearest cities:
(Note: Based on data for the last 3 years, including only cities with population 5,000 and above)
| Palm Coast: | 25.2 |
| Ormond Beach: | 53.8 |
| Holly Hill: | 49.3 |
| Daytona Beach: | 60.0 |
| Palatka: | 64.5 |
| South Daytona: | 8.3 |
| Port Orange: | 22.2 |
| New Smyrna Beach: | 81.6 |
| Orange City: | 114.3 |
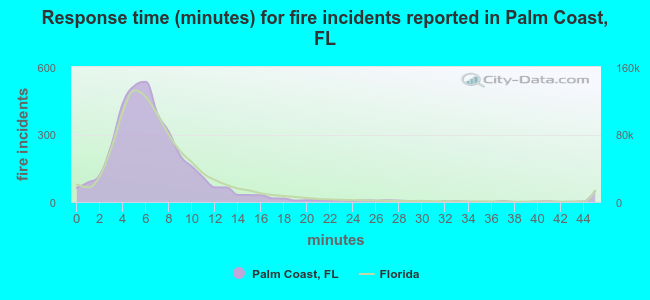 The median response time based on all reported fire incidents is 6 minutes. This is similar to the state median value.
The median response time in Palm Coast, FL compared to nearest cities:
(Note: Based on data for all years, including only cities with at least 500 fire incidents)
| Palm Coast: | 6 minutes |
| Bunnell: | 12 minutes |
| Ormond Beach: | 6 minutes |
| Hastings: | 12 minutes |
| Holly Hill: | 5 minutes |
| St. Augustine: | 8 minutes |
| Daytona Beach: | 5 minutes |
| Palatka: | 6 minutes |
| Port Orange: | 6 minutes |
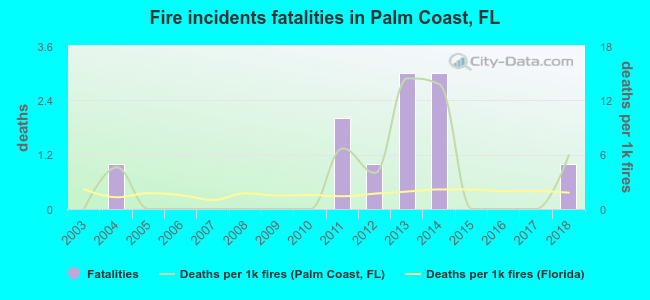 According to the data from the years 2003 - 2018 the average number of fire-related fatalities per year is 1. The highest number of deaths - 3 took place in 2013, and the lowest - 0 in 2003. The data has an increasing trend.
The average number of deaths per 1,000 fires is 3. This indicator was the highest - 14 in 2013, and the lowest 0 in 2003. The trend for deaths per 1,000 fire incidents is increasing. Compared to the Florida value the number of deaths per 1,000 fire incidents is higher.
According to the data from the years 2003 - 2018 the average number of fire-related fatalities per year is 1. The highest number of deaths - 3 took place in 2013, and the lowest - 0 in 2003. The data has an increasing trend.
The average number of deaths per 1,000 fires is 3. This indicator was the highest - 14 in 2013, and the lowest 0 in 2003. The trend for deaths per 1,000 fire incidents is increasing. Compared to the Florida value the number of deaths per 1,000 fire incidents is higher.Deaths per 1,000 incidents in Palm Coast, FL compared to nearest cities:
(Note: Based on data for all years, including only cities with at least 2,500 fire incidents)
| Palm Coast: | 3.1 |
| Ormond Beach: | 2.3 |
| St. Augustine: | 2.3 |
| Daytona Beach: | 2.4 |
| Palatka: | 1.1 |
| Deltona: | 0.8 |
| Sanford: | 2.3 |
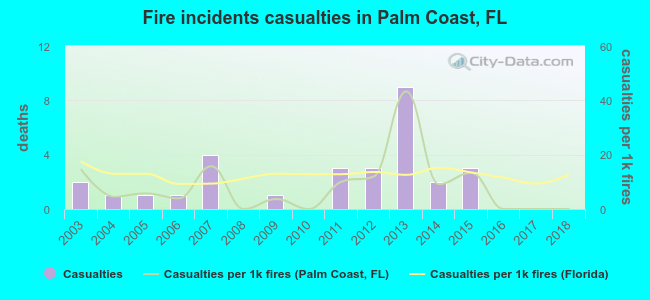 According to the data from the years 2003 - 2018 the average number of fire-related casualties per year is 2. The highest number of injuries - 9 took place in 2013, and the lowest - 0 in 2008. The data has a decreasing trend.
The average number of casualties per 1,000 fire incidents is 8. This indicator was the highest - 43 in 2013, and the lowest 0 in 2008. The trend for injuries per 1,000 fire incidents is declining. Compared to the state value the number of casualties per 1,000 fires is lower.
According to the data from the years 2003 - 2018 the average number of fire-related casualties per year is 2. The highest number of injuries - 9 took place in 2013, and the lowest - 0 in 2008. The data has a decreasing trend.
The average number of casualties per 1,000 fire incidents is 8. This indicator was the highest - 43 in 2013, and the lowest 0 in 2008. The trend for injuries per 1,000 fire incidents is declining. Compared to the state value the number of casualties per 1,000 fires is lower.Casualties per 1,000 incidents in Palm Coast, FL compared to nearest cities:
(Note: Based on data for all years, including only cities with at least 500 fire incidents)
| Palm Coast: | 8.4 |
| Bunnell: | 1.9 |
| Ormond Beach: | 9.9 |
| Hastings: | 17.4 |
| Holly Hill: | 16.9 |
| St. Augustine: | 11.7 |
| Daytona Beach: | 23.2 |
| Palatka: | 9.4 |
| Port Orange: | 23.4 |
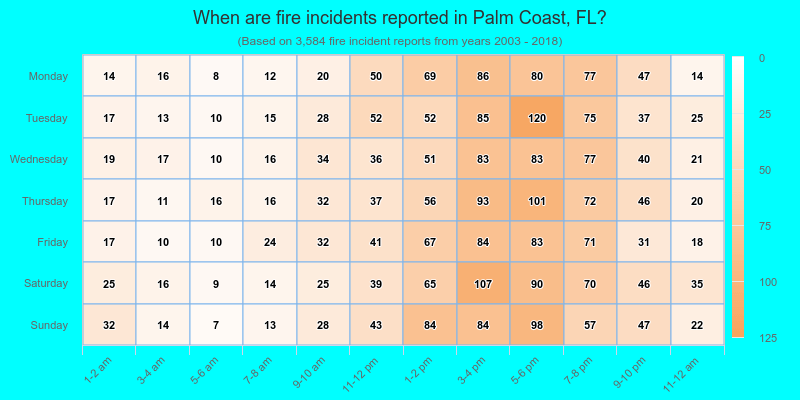
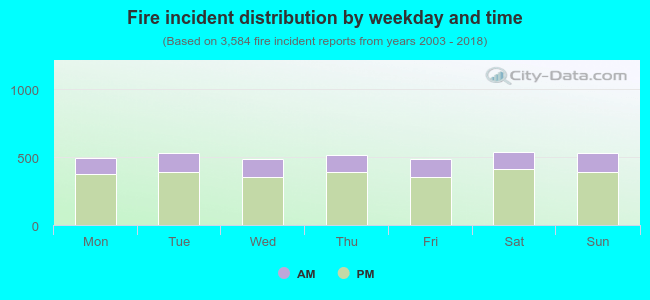 25.5% incidents where reported in the morning and 74.5% in the evening. The most fires (15.1%) took place on Saturday, and the least (13.6%) on Wednesday.
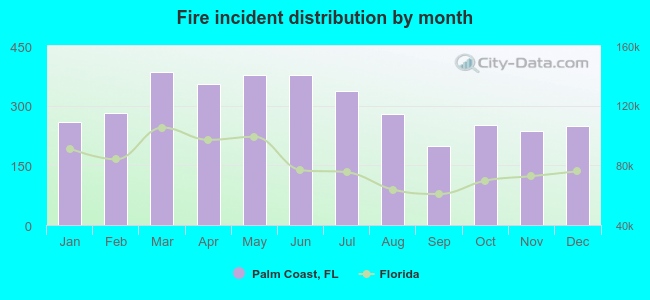 According to the 3,584 fire incident reports from years 2003 - 2018 most fires (10.7%) took place during March, and the least (5.6%) in September.
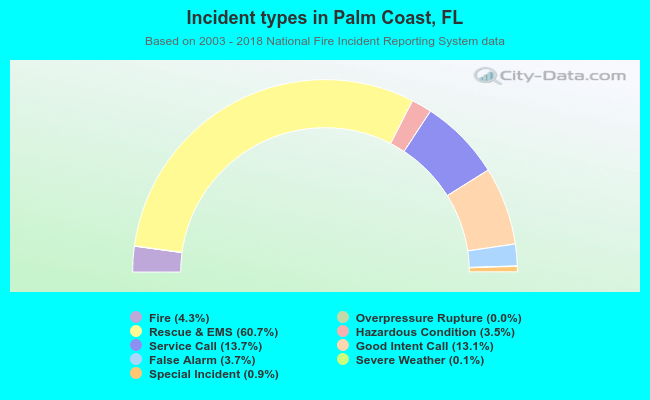 Out of all 83,198 cases reported during the years 2003 - 2018, the most belonged to the categories: Rescue & EMS (60.7%), Service Call (13.7%), and Good Intent Call (13.1%).
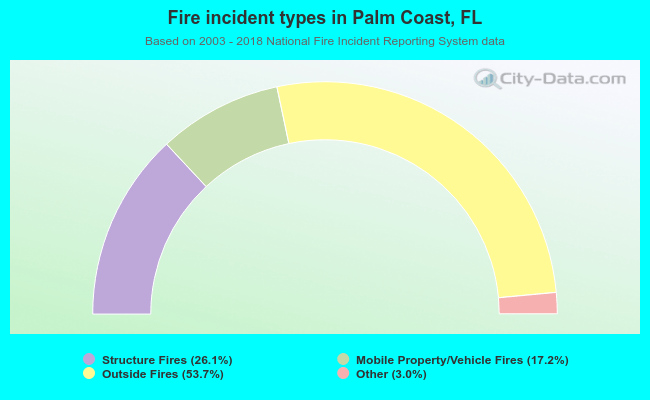 When looking into fire subcategories, the most reports belonged to: Outside Fires (53.7%), and Structure Fires (26.1%).