Prosper: Fire Incidents, Texas (TX)
Where are fire incidents reported in Prosper, TX
Something went wrong! Please refresh the page.
|
| |||||||||||||||||||||||||||||||||||||||||||||||||||||||||||||||||||||||||||||||||||||||||||||||||||||||||||||
2003 - 2018 National Fire Incident Reporting System (NFIRS) incidents
- Incident types reported to NFIRS in Prosper, TX
- 3,66247.2%Rescue & EMS
- 1,31917.0%Service Call
- 7449.6%Fire
- 7369.5%False Alarm
- 6218.0%Good Intent Call
- 6077.8%Hazardous Condition
- 290.4%Severe Weather
- 280.4%Overpressure Rupture
- Fire incident types reported to NFIRS in Prosper, TX
- 40654.6%Outside Fires
- 22430.1%Structure Fires
- 8411.3%Mobile Property/Vehicle Fires
- 304.0%Other
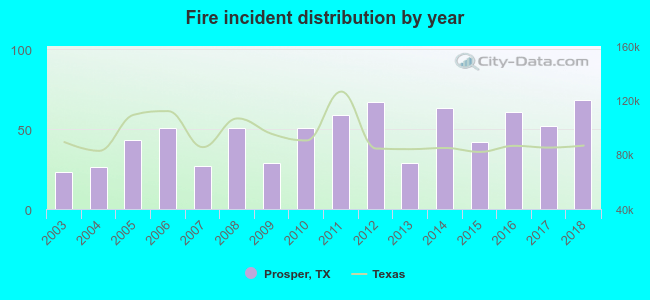 According to the data from the years 2003 - 2018 the average number of fires per year is 46. The highest number of fire incidents - 68 took place in 2018, and the least - 23 in 2003. The data has a rising trend.
The average number of yearly fire incidents per 10k residents in Prosper, TX compared to nearest cities:
(Note: Based on data for the last 3 years, including only cities with population 5,000 and above)
| Prosper: | 41.9 |
| Celina: | 84.7 |
| Frisco: | 17.9 |
| McKinney: | 16.5 |
| Little Elm: | 33.7 |
| Colony: | 0.2 |
| The Colony: | 16.8 |
| Fairview: | 41.5 |
| Allen: | 14.0 |
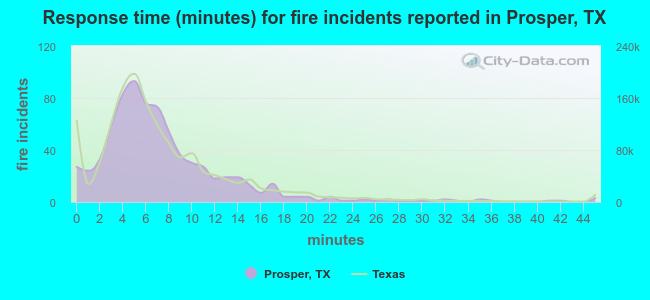 The median response time based on all reported fire incidents is 6 minutes. This is about the same as the Texas median value.
The median response time in Prosper, TX compared to nearest cities:
(Note: Based on data for all years, including only cities with at least 500 fire incidents)
| Prosper: | 6 minutes |
| Celina: | 9 minutes |
| Frisco: | 5 minutes |
| McKinney: | 6 minutes |
| Little Elm: | 7 minutes |
| The Colony: | 5 minutes |
| Allen: | 6 minutes |
| Aubrey: | 9 minutes |
| Melissa: | 8 minutes |
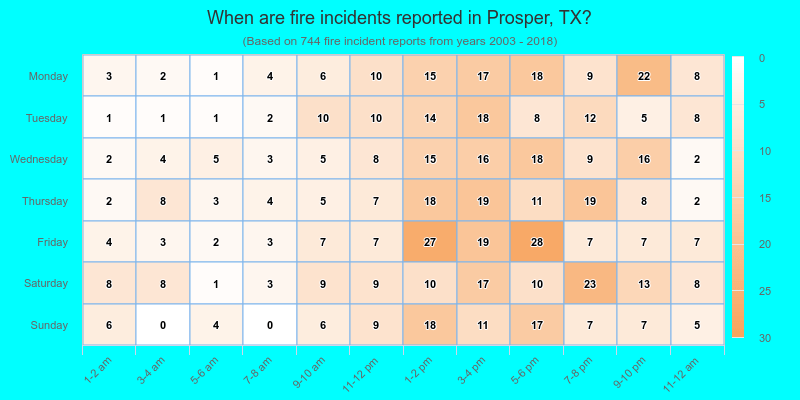
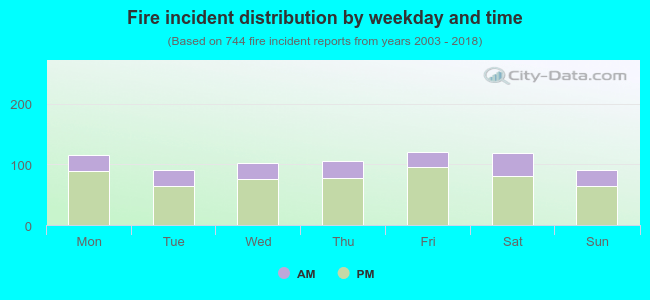 26.3% incidents where reported in the morning and 73.7% in the evening. The most fires (16.3%) took place on Friday, and the least (12.1%) on Tuesday.
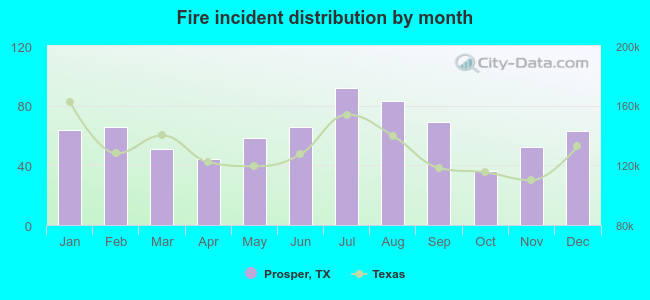 Based on the 744 fire incidents from years 2003 - 2018 most fires (12.4%) took place during July, and the least (4.8%) in October.
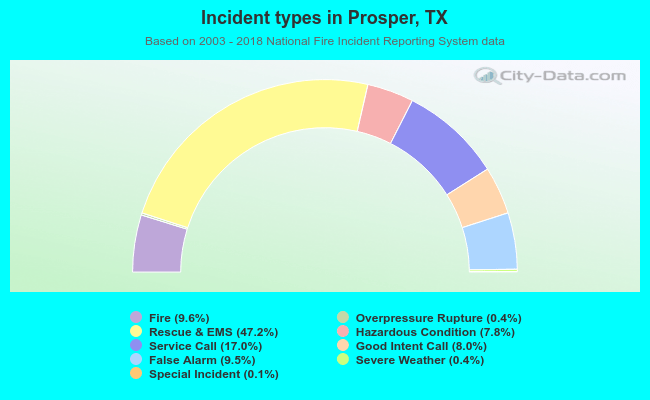 Out of all 7,752 cases reported during the years 2003 - 2018, the most belonged to the categories: Rescue & EMS (47.2%), Service Call (17.0%), and Fire (9.6%).
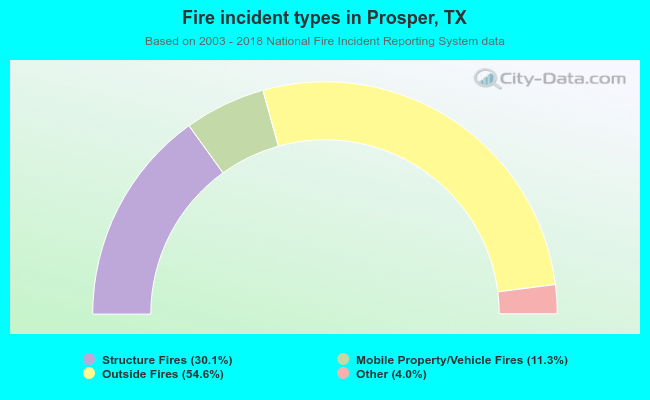 When looking into fire subcategories, the most reports belonged to: Outside Fires (54.6%), and Structure Fires (30.1%).