Queensbury: Fire Incidents, New York (NY)
Where are fire incidents reported in Queensbury, NY
Something went wrong! Please refresh the page.
| Fire incidents reported | |
|---|---|
| Sreet name | Count |
| LONGVIEW DR | 210 |
| RIDGE RD | 124 |
| STATE ROUTE 9 | 116 |
| BAY ROAD | 62 |
| UPPER GLEN STREET | 62 |
| AVIATION ROAD | 58 |
| BAY RD | 48 |
| CORINTH RD | 46 |
| QUAKER ROAD | 40 |
| LUZERNE RD | 34 |
| QUAKER RD | 30 |
| AVIATION RD | 24 |
| DIX AVE | 24 |
| KENWOOD CIR | 24 |
| MAIN ST | 24 |
| PEGGY ANN ROAD | 24 |
| UPPER GLEN ST | 24 |
| JENKINSVILLE RD | 22 |
| EVERGREEN LN | 20 |
| I87 SOUTHBOUND | 20 |
| QUEENSBURY AVE | 20 |
| WEST MOUNTAIN RD | 20 |
| WILLOWBROOK RD | 20 |
| BURKE DRIVE | 18 |
| I-87 NORTH | 18 |
| ROCKWELL RD | 18 |
| BIG BAY RD | 16 |
| I87 NORTHBOUND | 16 |
| PEGGY ANN RD | 16 |
| WEST MOUNTAIN ROAD | 16 |
| Other | 514 |
2002 - 2018 National Fire Incident Reporting System (NFIRS) incidents
- Incident types reported to NFIRS in Queensbury, NY
- 7,38051.4%Rescue & EMS
- 2,00614.0%Hazardous Condition
- 1,72812.0%Fire
- 1,72612.0%False Alarm
- 7495.2%Service Call
- 5864.1%Good Intent Call
- 1230.9%Severe Weather
- 400.3%Special Incident
- 230.2%Overpressure Rupture
- Fire incident types reported to NFIRS in Queensbury, NY
- 92753.6%Structure Fires
- 48027.8%Outside Fires
- 23713.7%Mobile Property/Vehicle Fires
- 844.9%Other
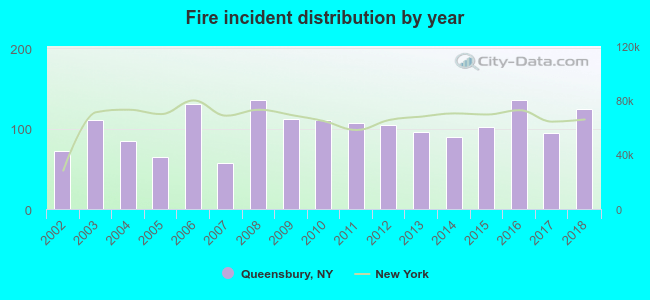 Based on the data from the years 2002 - 2018 the average number of fire incidents per year is 102. The highest number of fire incidents - 135 took place in 2008, and the least - 57 in 2007. The data has a growing trend.
The average number of yearly fire incidents per 10k residents in Queensbury, NY compared to nearest cities:
(Note: Based on data for the last 3 years, including only cities with population 5,000 and above)
| Queensbury: | 42.2 |
| Glens Falls: | 37.4 |
| Moreau: | 11.1 |
| Hudson Falls: | 56.3 |
| Kingsbury: | 6.1 |
| Northumberland: | 2.0 |
| Wilton: | 11.3 |
| Greenfield: | 14.8 |
| Saratoga Springs: | 38.1 |
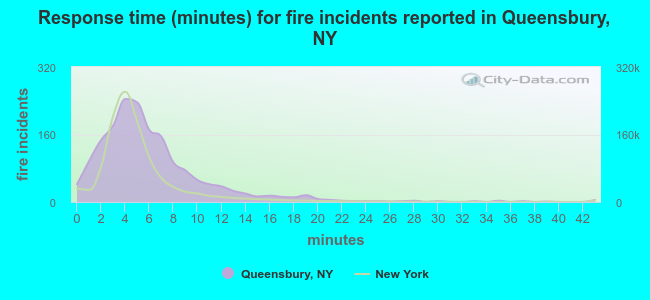 The median response time based on all reported fire incidents is 5 minutes. This is higher than the New York median value.
The median response time in Queensbury, NY compared to nearest cities:
(Note: Based on data for all years, including only cities with at least 500 fire incidents)
| Queensbury: | 5 minutes |
| Glens Falls: | 3 minutes |
| Hudson Falls: | 7 minutes |
| Lake George: | 7 minutes |
| Saratoga Springs: | 5 minutes |
| Mechanicville: | 5 minutes |
| Broadalbin: | 6 minutes |
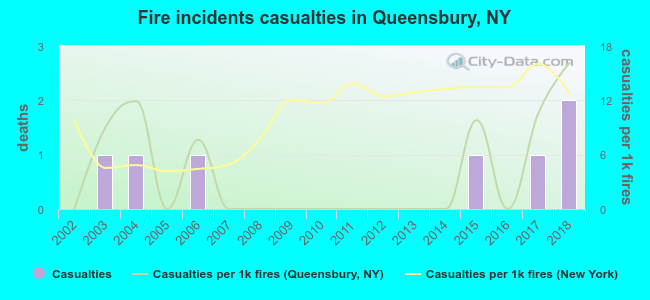 Based on the data from the years 2002 - 2018 the average number of fire-related casualties per year is 0. The highest number of reported casualties - 2 took place in 2018, and the lowest - 0 in 2002. The data has a rising trend.
The average number of injuries per 1,000 fire incidents is 4. This indicator was the highest - 16 in 2018, and the lowest 0 in 2002. The trend for injuries per 1,000 fires is increasing. Compared to the New York value the number of injuries per 1,000 incidents is much lower.
Based on the data from the years 2002 - 2018 the average number of fire-related casualties per year is 0. The highest number of reported casualties - 2 took place in 2018, and the lowest - 0 in 2002. The data has a rising trend.
The average number of injuries per 1,000 fire incidents is 4. This indicator was the highest - 16 in 2018, and the lowest 0 in 2002. The trend for injuries per 1,000 fires is increasing. Compared to the New York value the number of injuries per 1,000 incidents is much lower.Casualties per 1,000 incidents in Queensbury, NY compared to nearest cities:
(Note: Based on data for all years, including only cities with at least 500 fire incidents)
| Queensbury: | 4.1 |
| Glens Falls: | 42.5 |
| Hudson Falls: | 6.7 |
| Lake George: | 4.7 |
| Saratoga Springs: | 13.0 |
| Mechanicville: | 9.4 |
| Broadalbin: | 0.0 |
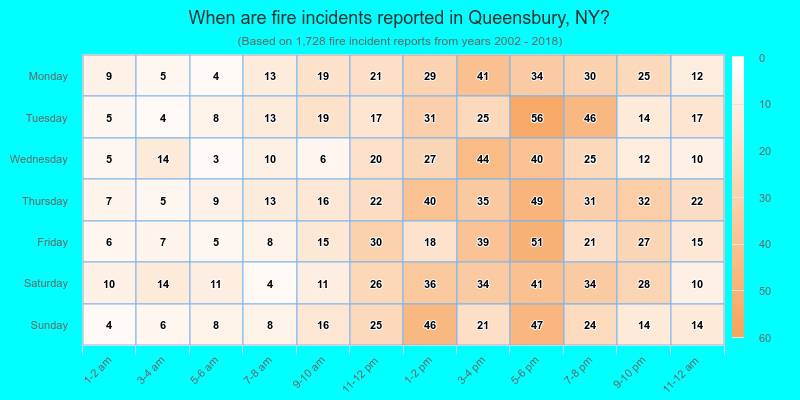
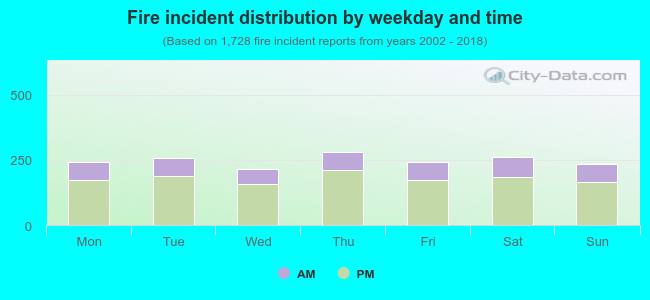 27.8% incidents where reported in the morning and 72.2% in the evening. The most fires (16.3%) took place on Thursday, and the least (12.5%) on Wednesday.
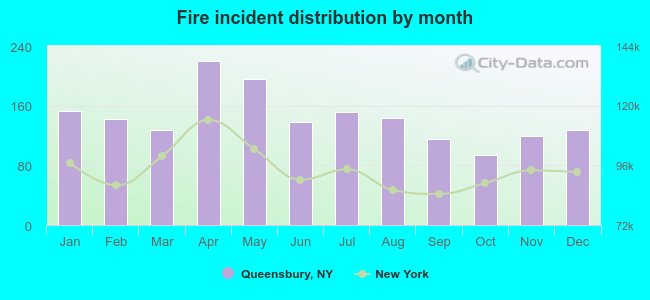 According to the 1,728 reports from years 2002 - 2018 most fires (12.7%) took place during April, and the least (5.4%) in October.
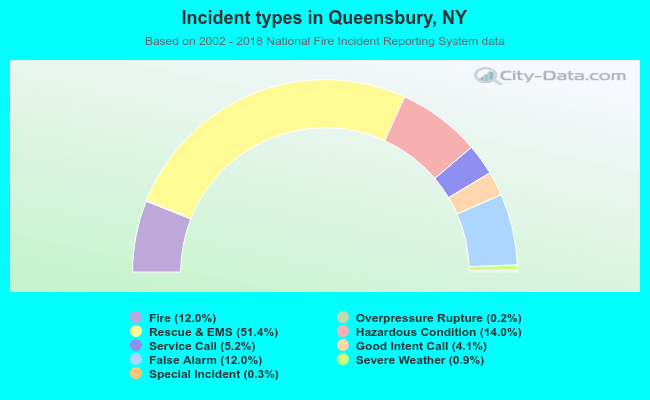 Out of all 14,361 cases reported during the years 2002 - 2018, the most belonged to the categories: Rescue & EMS (51.4%), Hazardous Condition (14.0%), and Fire (12.0%).
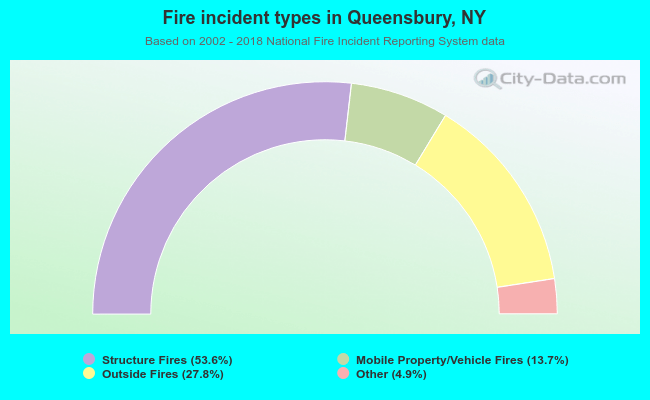 When looking into fire subcategories, the most reports belonged to: Structure Fires (53.6%), and Outside Fires (27.8%).