Wilton: Fire Incidents, New York (NY)
Where are fire incidents reported in Wilton, NY
Something went wrong! Please refresh the page.
|
| |||||||||||||||||||||||||||||||||||||||||||||||||||||||||||||||||||||||||||||||||||||||||||||||||||||||||||||
2002 - 2018 National Fire Incident Reporting System (NFIRS) incidents
- Incident types reported to NFIRS in Wilton, NY
- 79629.7%Hazardous Condition
- 49418.4%Fire
- 44616.6%Rescue & EMS
- 40315.0%False Alarm
- 33412.5%Good Intent Call
- 1997.4%Service Call
- 70.3%Overpressure Rupture
- Fire incident types reported to NFIRS in Wilton, NY
- 22445.3%Structure Fires
- 13026.3%Mobile Property/Vehicle Fires
- 11723.7%Outside Fires
- 234.7%Other
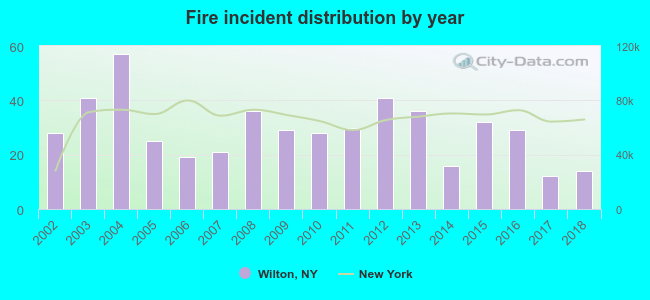 Based on the data from the years 2002 - 2018 the average number of fires per year is 29. The highest number of fire incidents - 57 took place in 2004, and the least - 12 in 2017. The data has a declining trend.
The average number of yearly fire incidents per 10k residents in Wilton, NY compared to nearest cities:
(Note: Based on data for the last 3 years, including only cities with population 5,000 and above)
| Wilton: | 11.3 |
| Saratoga Springs: | 38.1 |
| Northumberland: | 2.0 |
| Greenfield: | 14.8 |
| Moreau: | 11.1 |
| Ballston Spa: | 17.9 |
| Glens Falls: | 37.4 |
| Malta: | 29.1 |
| Hudson Falls: | 56.3 |
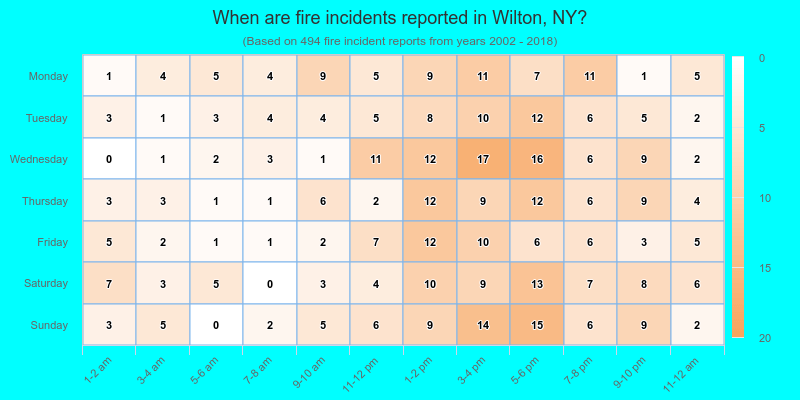
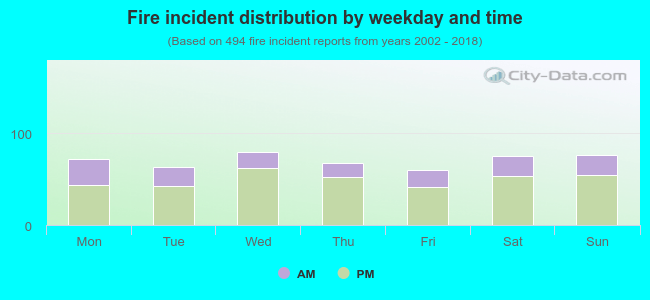 28.9% incidents where reported in the morning and 71.1% in the evening. The most fires (16.2%) took place on Wednesday, and the least (12.1%) on Friday.
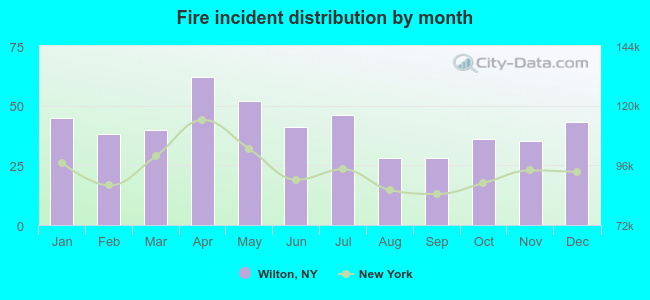 According to the 494 incident reports from years 2002 - 2018 most fires (12.6%) took place during April, and the least (5.7%) in August.
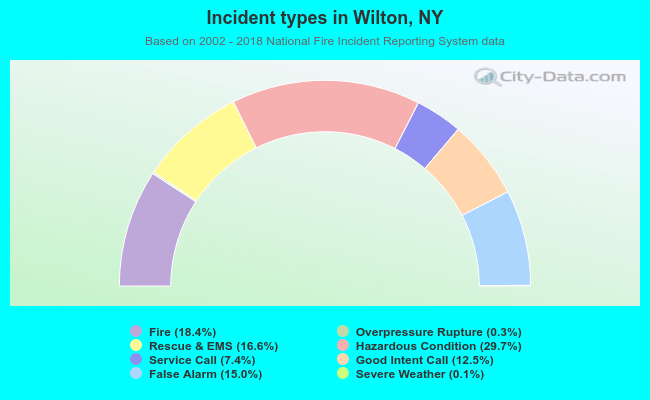 Out of all 2,681 cases reported during the years 2002 - 2018, the most belonged to the categories: Hazardous Condition (29.7%), Fire (18.4%), and Rescue & EMS (16.6%).
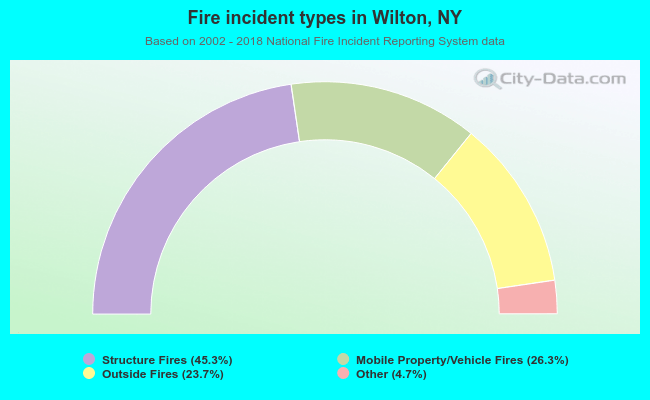 When looking into fire subcategories, the most reports belonged to: Structure Fires (45.3%), and Mobile Property/Vehicle Fires (26.3%).