Ridge: Fire Incidents, New York (NY)
Where are fire incidents reported in Ridge, NY
Something went wrong! Please refresh the page.
|
| |||||||||||||||||||||||||||||||||||||||||||||||||||||||||||||||||||||||||||||||||||||||||||||||||||||||||||||
2003 - 2018 National Fire Incident Reporting System (NFIRS) incidents
- Incident types reported to NFIRS in Ridge, NY
- 6,58075.4%Rescue & EMS
- 1,10912.7%False Alarm
- 4945.7%Fire
- 2613.0%Hazardous Condition
- 1431.6%Good Intent Call
- 1221.4%Service Call
- 90.1%Overpressure Rupture
- Fire incident types reported to NFIRS in Ridge, NY
- 22645.7%Structure Fires
- 15331.0%Outside Fires
- 7214.6%Other
- 438.7%Mobile Property/Vehicle Fires
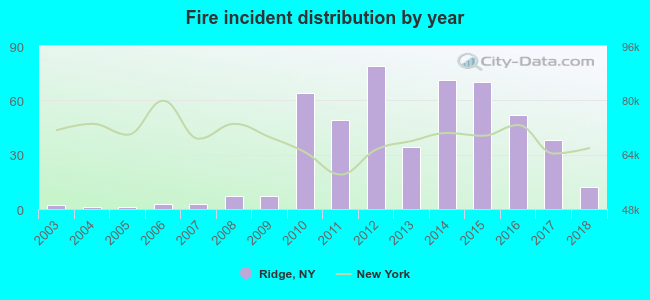 Based on the data from the years 2003 - 2018 the average number of fire incidents per year is 31. The highest number of fires - 79 took place in 2012, and the least - 1 in 2004. The data has a growing trend.
The average number of yearly fire incidents per 10k residents in Ridge, NY compared to nearest cities:
(Note: Based on data for the last 3 years, including only cities with population 5,000 and above)
| Ridge: | 25.5 |
| Middle Island: | 38.8 |
| Rocky Point: | 30.2 |
| Wading River: | 17.7 |
| Yaphank: | 26.4 |
| Sound Beach: | 28.0 |
| Manorville: | 12.1 |
| Miller Place: | 19.5 |
| Coram: | 17.3 |
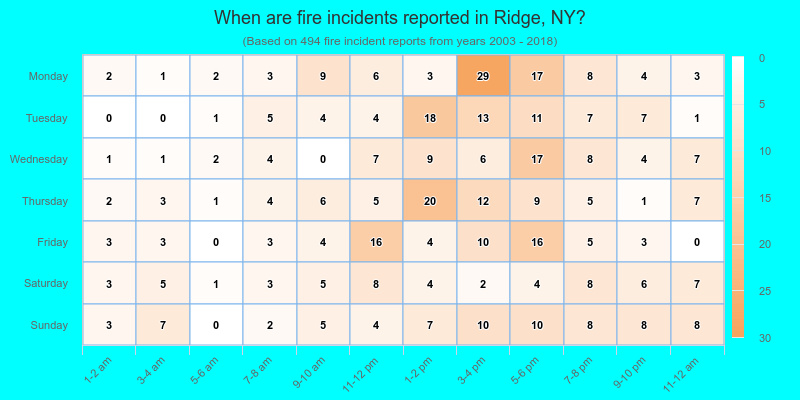
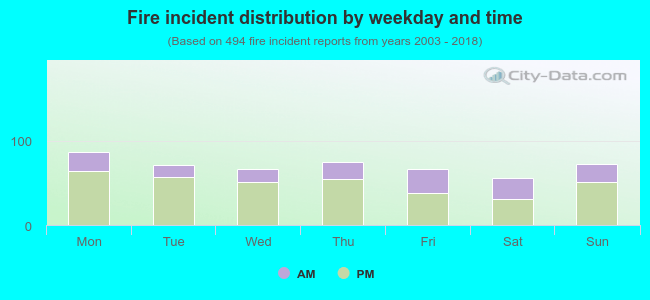 30.0% incidents where reported in the morning and 70.0% in the evening. The most fires (17.6%) took place on Monday, and the least (11.3%) on Saturday.
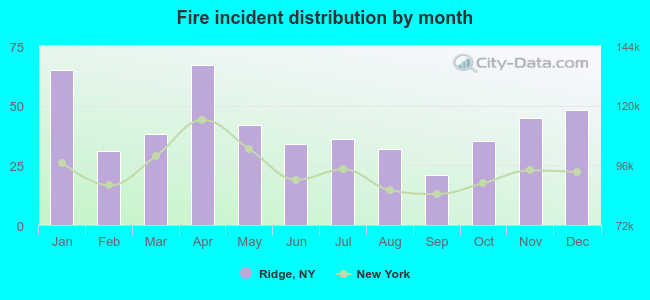 Based on the 494 fire incident reports from years 2003 - 2018 most fires (13.6%) took place during April, and the least (4.3%) in September.
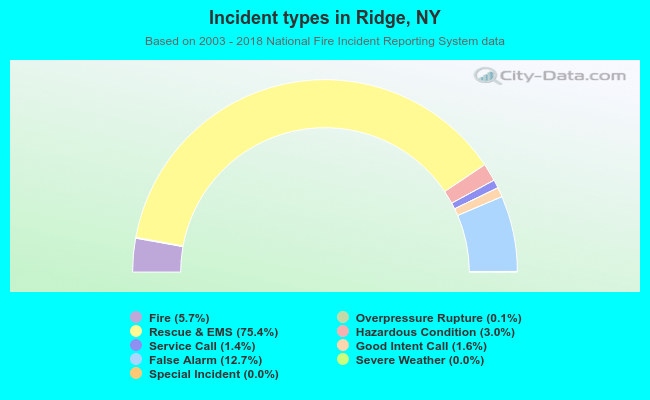 Out of all 8,724 cases reported during the years 2003 - 2018, the most belonged to the categories: Rescue & EMS (75.4%), False Alarm (12.7%), and Fire (5.7%).
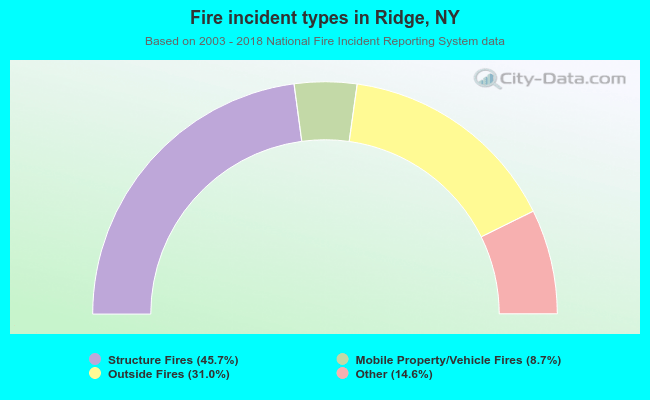 When looking into fire subcategories, the most incidents belonged to: Structure Fires (45.7%), and Outside Fires (31.0%).