Yaphank: Fire Incidents, New York (NY)
Where are fire incidents reported in Yaphank, NY
Something went wrong! Please refresh the page.
|
| |||||||||||||||||||||||||||||||||||||||||||||||||||||||||||||||||||||||||||||||||||||||||||||||||||||||||||||
2002 - 2018 National Fire Incident Reporting System (NFIRS) incidents
- Incident types reported to NFIRS in Yaphank, NY
- 65738.0%False Alarm
- 48628.1%Rescue & EMS
- 1599.2%Fire
- 1488.6%Hazardous Condition
- 1317.6%Good Intent Call
- 1237.1%Service Call
- 110.6%Special Incident
- 70.4%Overpressure Rupture
- 50.3%Severe Weather
- Fire incident types reported to NFIRS in Yaphank, NY
- 8050.3%Outside Fires
- 5132.1%Structure Fires
- 2314.5%Mobile Property/Vehicle Fires
- 53.1%Other
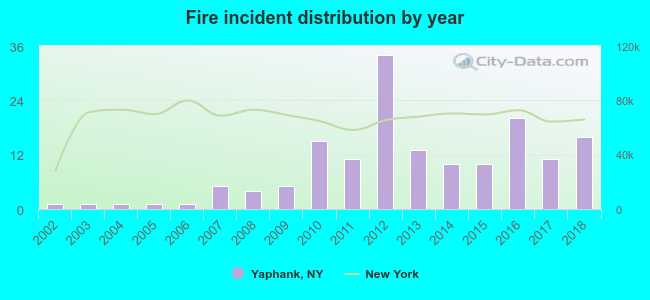 Based on the data from the years 2002 - 2018 the average number of fire incidents per year is 9. The highest number of fires - 34 took place in 2012, and the least - 1 in 2002. The data has a rising trend.
The average number of yearly fire incidents per 10k residents in Yaphank, NY compared to nearest cities:
(Note: Based on data for the last 3 years, including only cities with population 5,000 and above)
| Yaphank: | 26.4 |
| Medford: | 37.3 |
| Middle Island: | 38.8 |
| Shirley: | 20.6 |
| Mastic: | 12.3 |
| East Patchogue: | 22.5 |
| Ridge: | 25.5 |
| Coram: | 17.3 |
| Farmingville: | 26.1 |

 37.7% incidents where reported in the morning and 62.3% in the evening. The most fires (18.2%) took place on Friday, and the least (5.0%) on Wednesday.
 According to the 159 fire incidents from years 2002 - 2018 most fires (18.2%) took place during April, and the least (4.4%) in January.
 Out of all 1,727 cases reported during the years 2002 - 2018, the most belonged to the categories: False Alarm (38.0%), Rescue & EMS (28.1%), and Fire (9.2%).
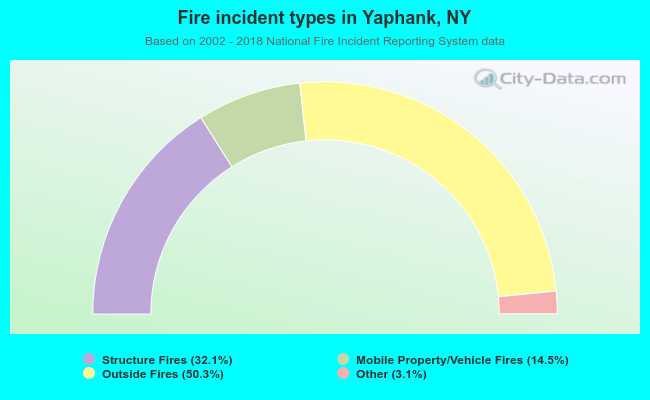 When looking into fire subcategories, the most reports belonged to: Outside Fires (50.3%), and Structure Fires (32.1%).