Wading River: Fire Incidents, New York (NY)
Where are fire incidents reported in Wading River, NY
Something went wrong! Please refresh the page.
|
| |||||||||||||||||||||||||||||||||||||||||||||||||||||||||||||||||||||||||||||||||||||||||||||||||||||||||||||
2002 - 2018 National Fire Incident Reporting System (NFIRS) incidents
- Incident types reported to NFIRS in Wading River, NY
- 2,17971.3%Rescue & EMS
- 37312.2%False Alarm
- 1805.9%Hazardous Condition
- 1344.4%Good Intent Call
- 1214.0%Fire
- 581.9%Service Call
- 50.2%Severe Weather
- 40.1%Special Incident
- Fire incident types reported to NFIRS in Wading River, NY
- 8066.1%Structure Fires
- 3730.6%Outside Fires
- 21.7%Mobile Property/Vehicle Fires
- 21.7%Other
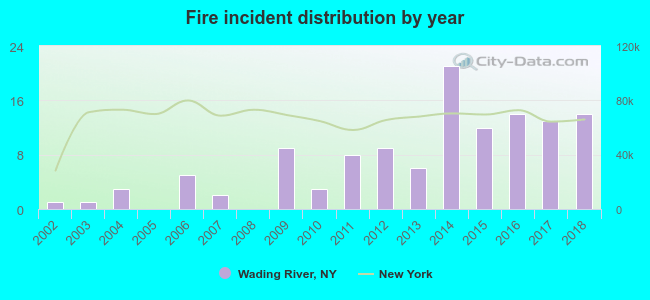 Based on the data from the years 2002 - 2018 the average number of fires per year is 7. The highest number of fires - 21 took place in 2014, and the least - 0 in 2005. The data has a growing trend.
The average number of yearly fire incidents per 10k residents in Wading River, NY compared to nearest cities:
(Note: Based on data for the last 3 years, including only cities with population 5,000 and above)
| Wading River: | 17.7 |
| Ridge: | 25.5 |
| Rocky Point: | 30.2 |
| Calverton: | 11.3 |
| Sound Beach: | 28.0 |
| Manorville: | 12.1 |
| Middle Island: | 38.8 |
| Miller Place: | 19.5 |
| Riverhead: | 7.3 |
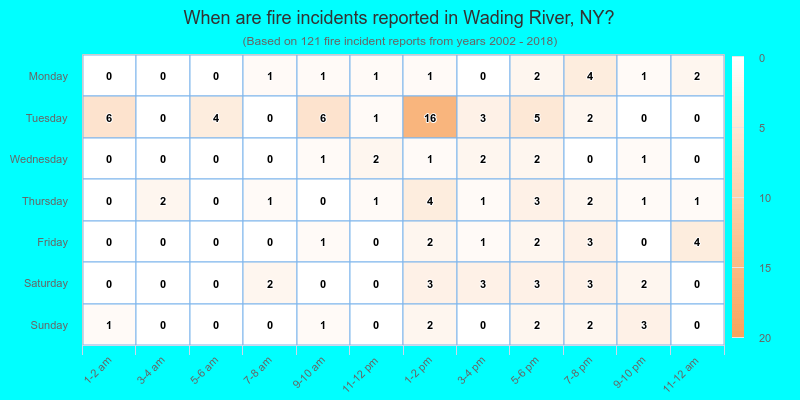
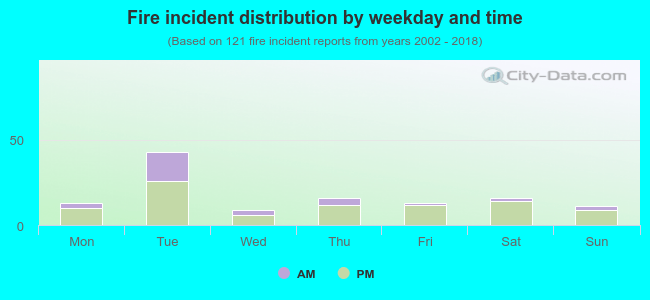 26.4% incidents where reported in the morning and 73.6% in the evening. The most fires (35.5%) took place on Tuesday, and the least (7.4%) on Wednesday.
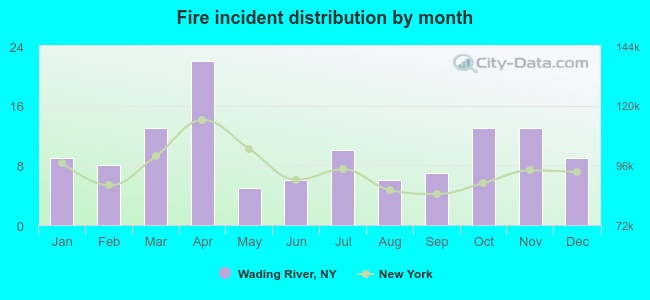 According to the 121 reports from years 2002 - 2018 most fires (18.2%) took place during April, and the least (4.1%) in May.
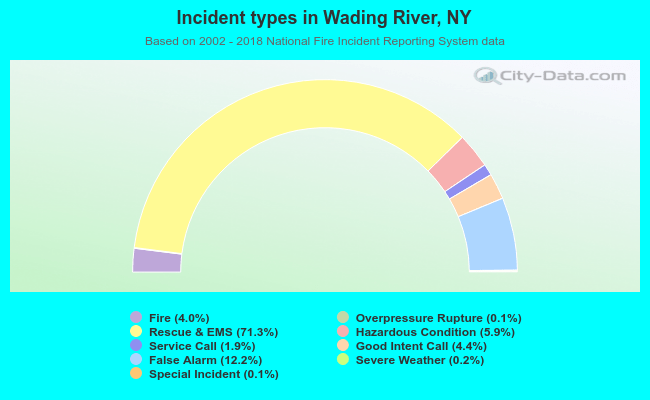 Out of all 3,057 cases reported during the years 2002 - 2018, the most belonged to the categories: Rescue & EMS (71.3%), False Alarm (12.2%), and Hazardous Condition (5.9%).
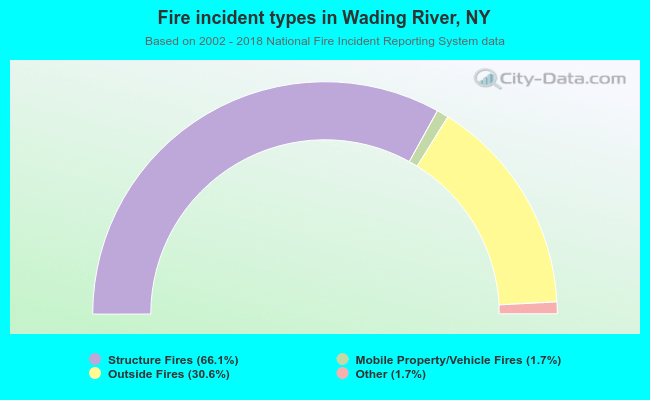 When looking into fire subcategories, the most reports belonged to: Structure Fires (66.1%), and Outside Fires (30.6%).