Manorville: Fire Incidents, New York (NY)
Where are fire incidents reported in Manorville, NY
Something went wrong! Please refresh the page.
|
| |||||||||||||||||||||||||||||||||||||||||||||||||||||||||||||||||||||||||||||||||||||||||||||||||||||||||||||
2002 - 2018 National Fire Incident Reporting System (NFIRS) incidents
- Incident types reported to NFIRS in Manorville, NY
- 74926.3%Fire
- 67923.9%False Alarm
- 61621.6%Rescue & EMS
- 53618.8%Hazardous Condition
- 1605.6%Good Intent Call
- 1013.5%Service Call
- 50.2%Overpressure Rupture
- Fire incident types reported to NFIRS in Manorville, NY
- 39252.3%Outside Fires
- 21228.3%Structure Fires
- 12216.3%Mobile Property/Vehicle Fires
- 233.1%Other
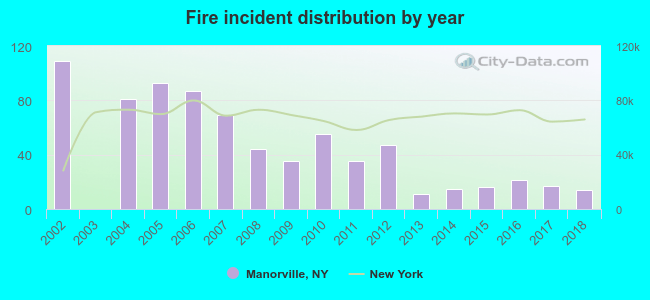 According to the data from the years 2002 - 2018 the average number of fire incidents per year is 44. The highest number of fire incidents - 109 took place in 2002, and the least - 0 in 2003. The data has a declining trend.
The average number of yearly fire incidents per 10k residents in Manorville, NY compared to nearest cities:
(Note: Based on data for the last 3 years, including only cities with population 5,000 and above)
| Manorville: | 12.1 |
| East Moriches: | 13.3 |
| Center Moriches: | 7.9 |
| Mastic: | 12.3 |
| Shirley: | 20.6 |
| Calverton: | 11.3 |
| Ridge: | 25.5 |
| Mastic Beach: | 21.3 |
| Yaphank: | 26.4 |
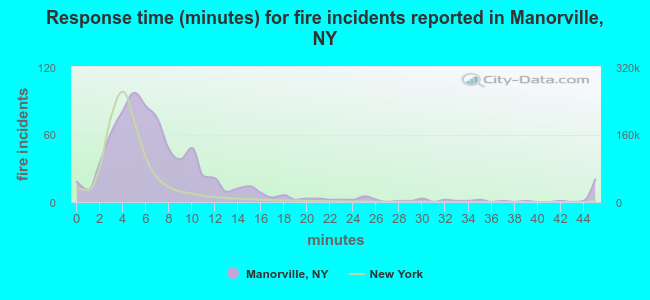 The median response time based on all reported fire incidents is 6 minutes. This is higher than the New York median value.
The median response time in Manorville, NY compared to nearest cities:
(Note: Based on data for all years, including only cities with at least 500 fire incidents)
| Manorville: | 6 minutes |
| Shirley: | 7 minutes |
| Mastic Beach: | 6 minutes |
| Middle Island: | 7 minutes |
| Bellport: | 5 minutes |
| Medford: | 4 minutes |
| East Patchogue: | 4 minutes |
| Coram: | 6 minutes |
| Miller Place: | 7 minutes |
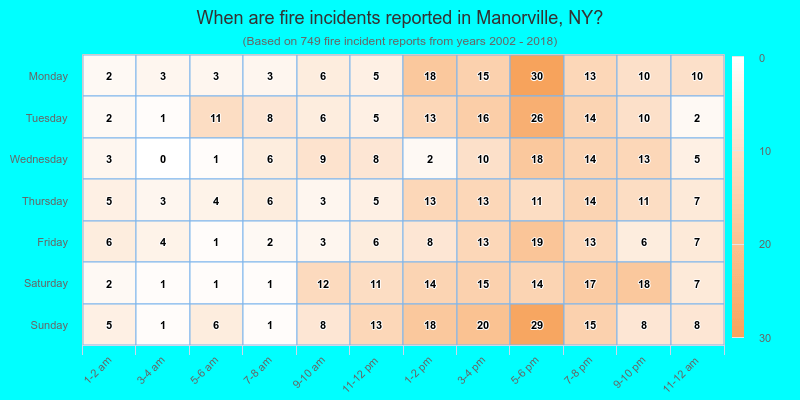
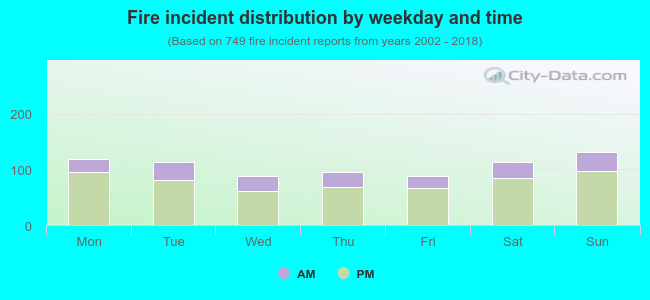 25.6% incidents where reported in the morning and 74.4% in the evening. The most fires (17.6%) took place on Sunday, and the least (11.7%) on Friday.
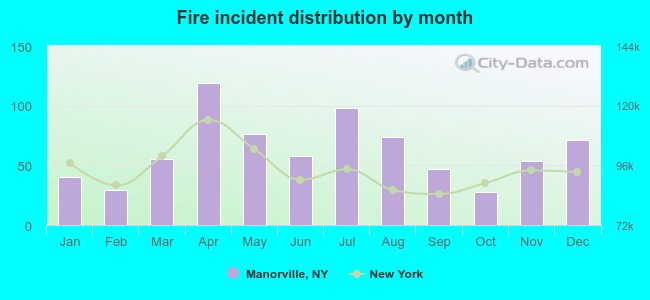 Based on the 749 incident reports from years 2002 - 2018 most fires (15.9%) took place during April, and the least (3.7%) in October.
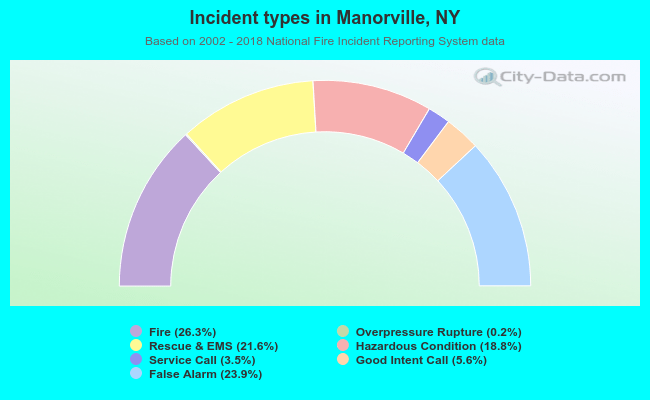 Out of all 2,846 cases reported during the years 2002 - 2018, the most belonged to the categories: Fire (26.3%), False Alarm (23.9%), and Rescue & EMS (21.6%).
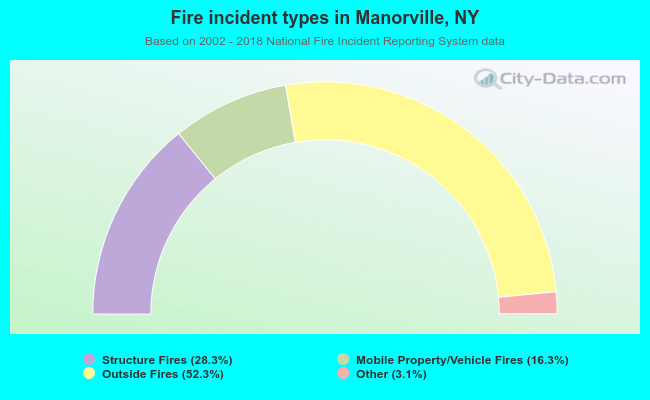 When looking into fire subcategories, the most reports belonged to: Outside Fires (52.3%), and Structure Fires (28.3%).