Riverhead: Fire Incidents, New York (NY)
Where are fire incidents reported in Riverhead, NY
Something went wrong! Please refresh the page.
|
| |||||||||||||||||||||||||||||||||||||||||||||||||||||||||||||||||||||||||||||||||||||||||||||||||||||||||||||
2002 - 2018 National Fire Incident Reporting System (NFIRS) incidents
- Incident types reported to NFIRS in Riverhead, NY
- 3,18958.8%False Alarm
- 1,26523.3%Hazardous Condition
- 3025.6%Rescue & EMS
- 2654.9%Fire
- 1963.6%Service Call
- 711.3%Overpressure Rupture
- 701.3%Good Intent Call
- 641.2%Special Incident
- Fire incident types reported to NFIRS in Riverhead, NY
- 14354.0%Outside Fires
- 11643.8%Structure Fires
- 62.3%Mobile Property/Vehicle Fires
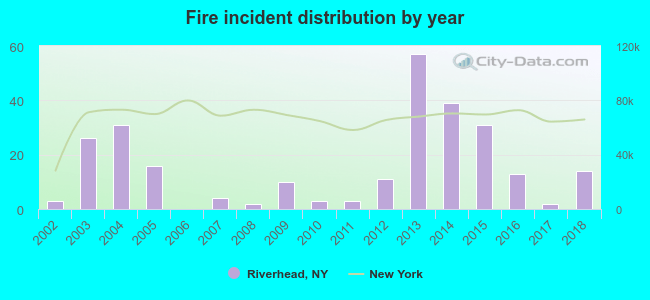 Based on the data from the years 2002 - 2018 the average number of fire incidents per year is 16. The highest number of fires - 57 took place in 2013, and the least - 0 in 2006. The data has a growing trend.
The average number of yearly fire incidents per 10k residents in Riverhead, NY compared to nearest cities:
(Note: Based on data for the last 3 years, including only cities with population 5,000 and above)
| Riverhead: | 7.3 |
| Calverton: | 11.3 |
| Hampton Bays: | 17.3 |
| Manorville: | 12.1 |
| Wading River: | 17.7 |
| East Moriches: | 13.3 |
| Center Moriches: | 7.9 |
| Ridge: | 25.5 |
| Mastic: | 12.3 |
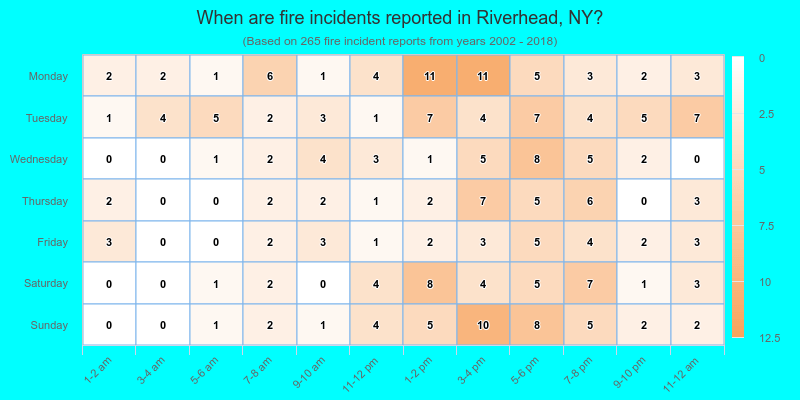
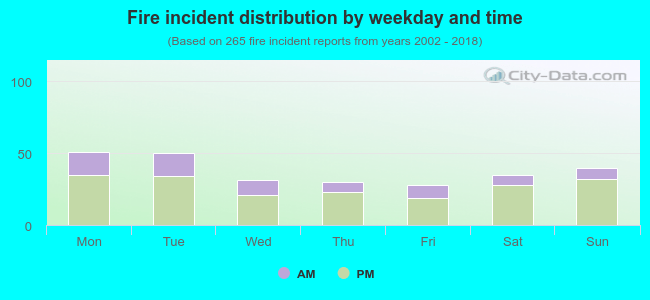 27.5% incidents where reported in the morning and 72.5% in the evening. The most fires (19.2%) took place on Monday, and the least (10.6%) on Friday.
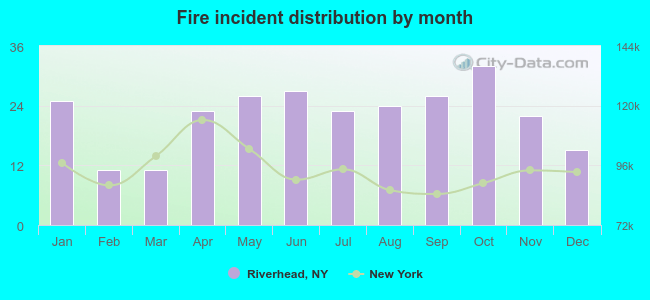 Based on the 265 fire incident reports from years 2002 - 2018 most fires (12.1%) took place during October, and the least (4.2%) in February.
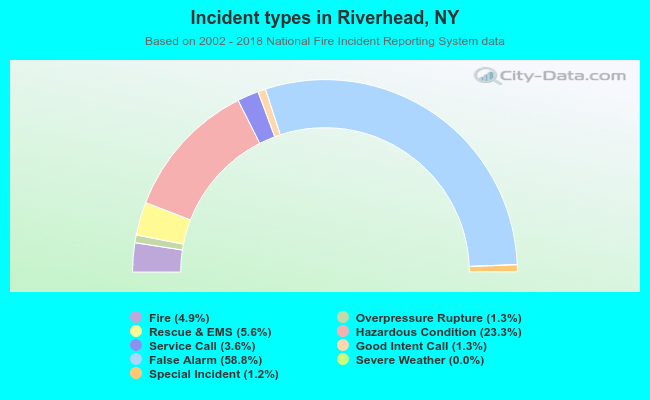 Out of all 5,424 cases reported during the years 2002 - 2018, the most belonged to the categories: False Alarm (58.8%), Hazardous Condition (23.3%), and Rescue & EMS (5.6%).
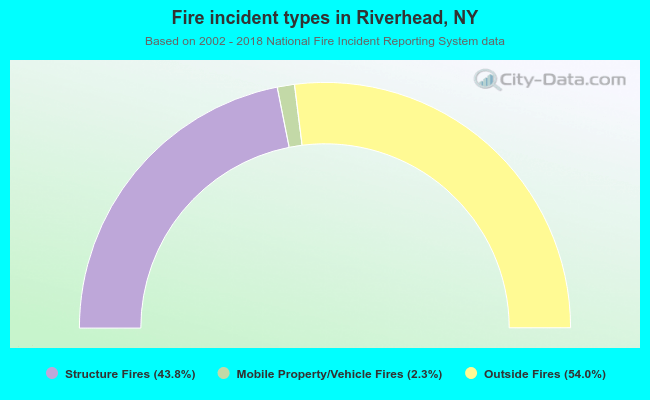 When looking into fire subcategories, the most incidents belonged to: Outside Fires (54.0%), and Structure Fires (43.8%).