Salem: Fire Incidents, Indiana (IN)
Where are fire incidents reported in Salem, IN
Something went wrong! Please refresh the page.
|
| |||||||||||||||||||||||||||||||||||||||||||||||||||||||||||||||||||||||||||||||||||||||||||||||||||||||||||||
| Other | 66 | |||||||||||||||||||||||||||||||||||||||||||||||||||||||||||||||||||||||||||||||||||||||||||||||||||||||||||||
2003 - 2018 National Fire Incident Reporting System (NFIRS) incidents
- Incident types reported to NFIRS in Salem, IN
- 64843.3%Fire
- 23815.9%Rescue & EMS
- 22815.2%Hazardous Condition
- 1409.4%Special Incident
- 936.2%Good Intent Call
- 875.8%False Alarm
- 513.4%Service Call
- 70.5%Severe Weather
- 40.3%Overpressure Rupture
- Fire incident types reported to NFIRS in Salem, IN
- 24037.0%Structure Fires
- 23836.7%Outside Fires
- 11217.3%Mobile Property/Vehicle Fires
- 589.0%Other
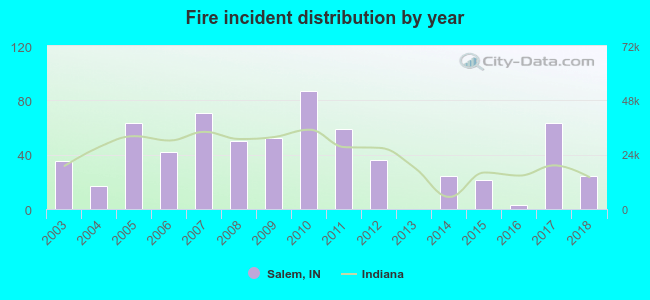 Based on the data from the years 2003 - 2018 the average number of fires per year is 40. The highest number of reported fire incidents - 87 took place in 2010, and the least - 0 in 2013. The data has a declining trend.
The average number of yearly fire incidents per 10k residents in Salem, IN compared to nearest cities:
(Note: Based on data for the last 3 years, including only cities with population 5,000 and above)
| Salem: | 48.1 |
| Scottsburg: | 4.0 |
| Sellersburg: | 36.8 |
| Charlestown: | 29.0 |
| New Albany: | 19.7 |
| Seymour: | 27.2 |
| Clarksville: | 2.3 |
| Bedford: | 44.7 |
| Jeffersonville: | 15.8 |
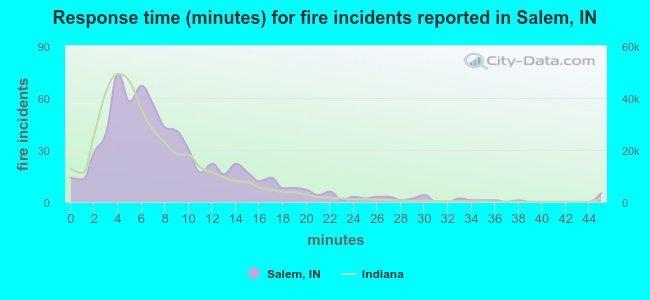 The median response time based on all reported fire incidents is 7 minutes. This is similar to the Indiana median value.
The median response time in Salem, IN compared to nearest cities:
(Note: Based on data for all years, including only cities with at least 500 fire incidents)
| Salem: | 7 minutes |
| Scottsburg: | 5 minutes |
| Georgetown: | 6 minutes |
| Mitchell: | 10 minutes |
| Sellersburg: | 6 minutes |
| Charlestown: | 7 minutes |
| New Albany: | 4 minutes |
| Seymour: | 4 minutes |
| Clarksville: | 4 minutes |
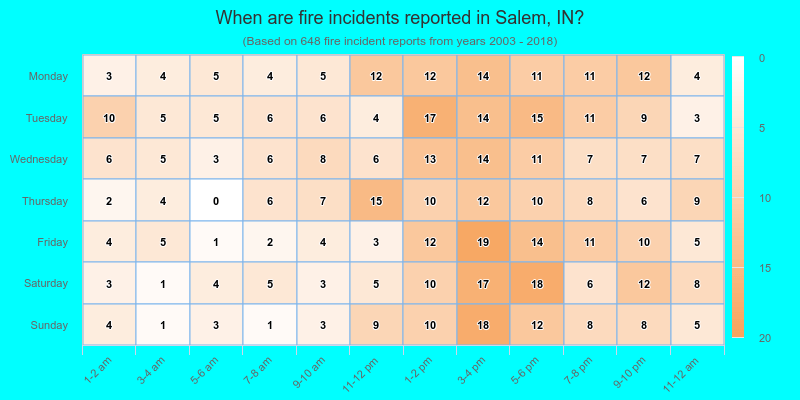
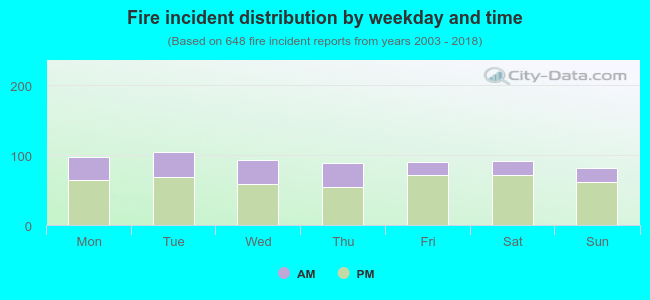 30.6% incidents where reported in the morning and 69.4% in the evening. The most fires (16.2%) took place on Tuesday, and the least (12.7%) on Sunday.
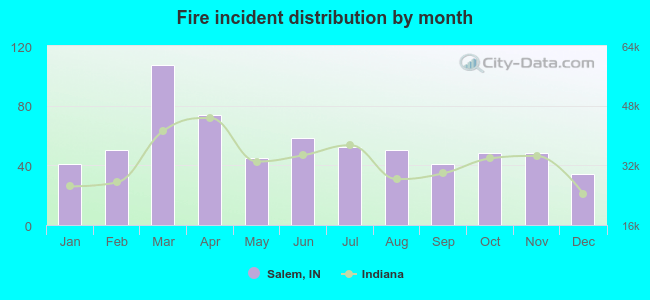 Based on the 648 fire incident reports from years 2003 - 2018 most fires (16.5%) took place during March, and the least (5.2%) in December.
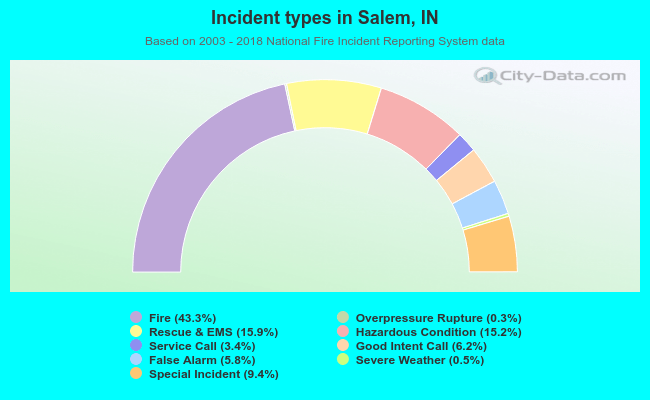 Out of all 1,496 cases reported during the years 2003 - 2018, the most belonged to the categories: Fire (43.3%), Rescue & EMS (15.9%), and Hazardous Condition (15.2%).
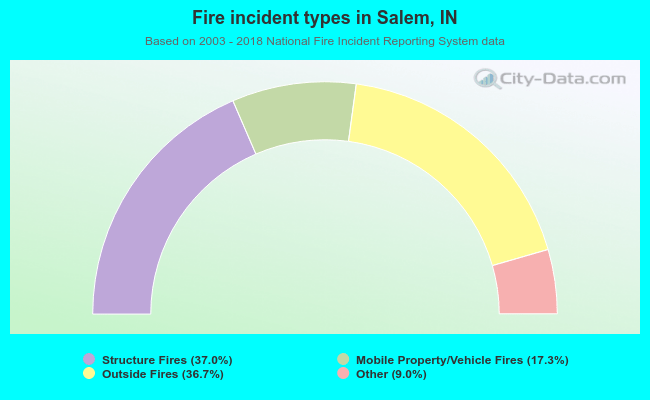 When looking into fire subcategories, the most incidents belonged to: Structure Fires (37.0%), and Outside Fires (36.7%).