Sayville: Fire Incidents, New York (NY)
Where are fire incidents reported in Sayville, NY
Something went wrong! Please refresh the page.
|
| |||||||||||||||||||||||||||||||||||||||||||||||||||||||||||||||||||||||||||||||||||||||||||||||||||||||||||||
2002 - 2018 National Fire Incident Reporting System (NFIRS) incidents
- Incident types reported to NFIRS in Sayville, NY
- 80426.7%Rescue & EMS
- 72023.9%Hazardous Condition
- 56218.7%False Alarm
- 44514.8%Fire
- 2307.6%Good Intent Call
- 2107.0%Service Call
- 331.1%Severe Weather
- 40.1%Overpressure Rupture
- Fire incident types reported to NFIRS in Sayville, NY
- 17539.3%Structure Fires
- 16837.8%Outside Fires
- 6514.6%Mobile Property/Vehicle Fires
- 378.3%Other
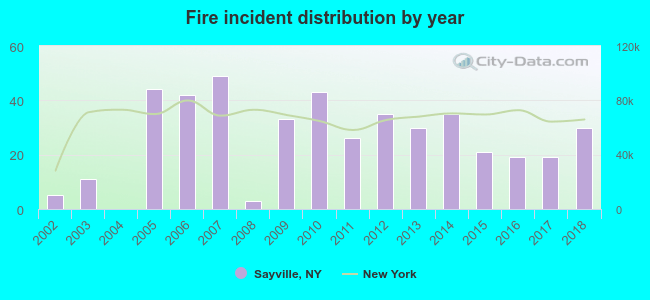 Based on the data from the years 2002 - 2018 the average number of fires per year is 26. The highest number of fire incidents - 49 took place in 2007, and the least - 0 in 2004. The data has a rising trend.
The average number of yearly fire incidents per 10k residents in Sayville, NY compared to nearest cities:
(Note: Based on data for the last 3 years, including only cities with population 5,000 and above)
| Sayville: | 13.4 |
| Bayport: | 7.1 |
| West Sayville: | 19.3 |
| Bohemia: | 32.1 |
| Oakdale: | 31.4 |
| Patchogue: | 85.5 |
| Holbrook: | 12.7 |
| North Patchogue: | 2.3 |
| Holtsville: | 9.6 |
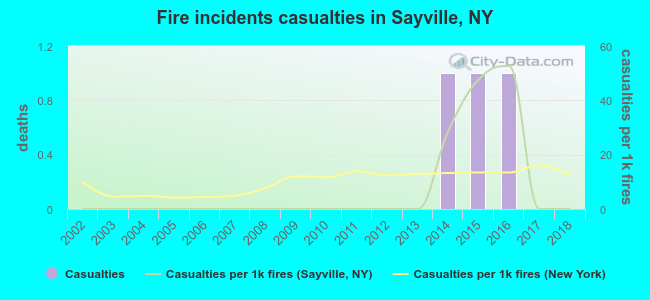 According to the reports from the years 2002 - 2018 the average number of fire-related casualties per year is 0. The highest number of injuries - 1 took place in 2014, and the lowest - 0 in 2002. The data has a constant trend.
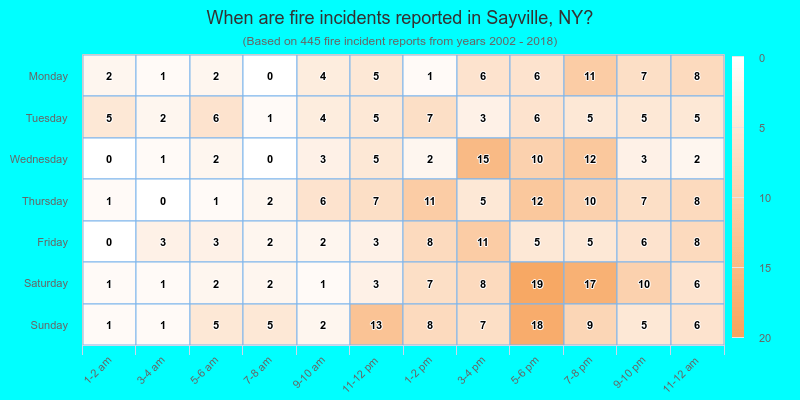
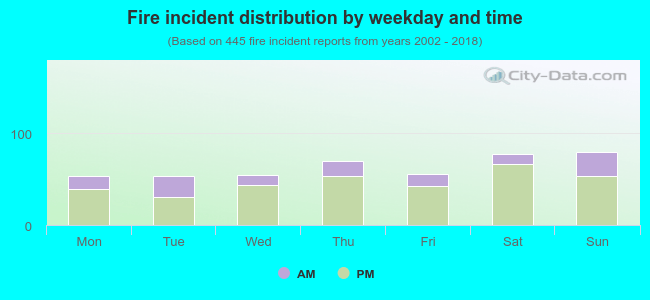 25.8% incidents where reported in the morning and 74.2% in the evening. The most fires (18.0%) took place on Sunday, and the least (11.9%) on Monday.
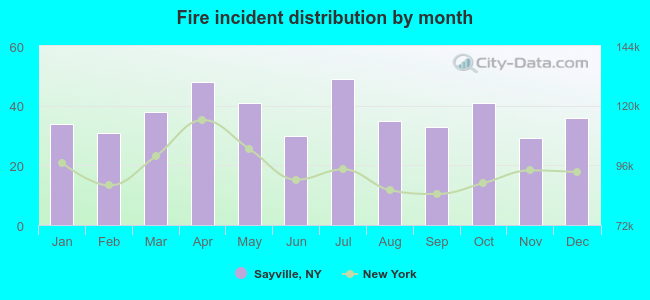 Based on the 445 incident reports from years 2002 - 2018 most fires (11.0%) took place during July, and the least (6.5%) in November.
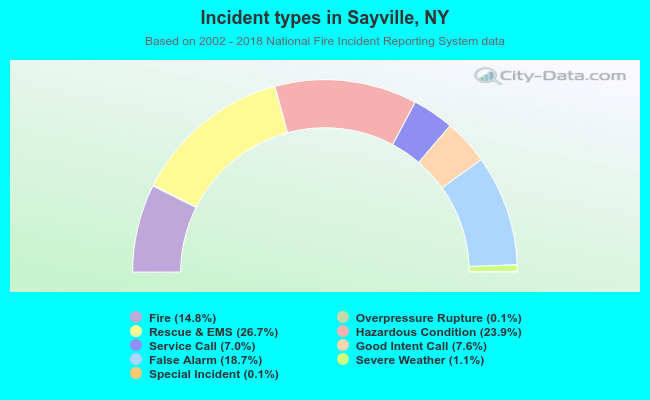 Out of all 3,010 cases reported during the years 2002 - 2018, the most belonged to the categories: Rescue & EMS (26.7%), Hazardous Condition (23.9%), and False Alarm (18.7%).
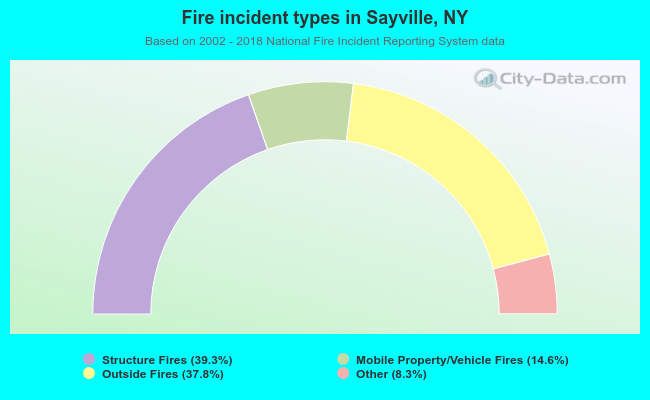 When looking into fire subcategories, the most incidents belonged to: Structure Fires (39.3%), and Outside Fires (37.8%).