Patchogue: Fire Incidents, New York (NY)
Where are fire incidents reported in Patchogue, NY
Something went wrong! Please refresh the page.
| Fire incidents reported | |
|---|---|
| Sreet name | Count |
| SUNRISE HIGHWAY | 112 |
| W MAIN ST | 108 |
| MEDFORD AVE | 104 |
| RIVER AVE | 98 |
| MONTAUK HWY | 94 |
| WAVERLY AVE | 94 |
| E MAIN ST | 92 |
| MAPLE AVE | 72 |
| BAY AVE | 68 |
| GROVE AVE | 68 |
| S OCEAN AVE | 68 |
| DIVISION ST | 64 |
| WEST AVE | 62 |
| RIDER AVE | 58 |
| SUNRISE HWY | 58 |
| WATERGATE LN | 56 |
| NORTON ST | 34 |
| CONKLIN AVE | 32 |
| N OCEAN AVE | 30 |
| OAK ST | 30 |
| HOSPITAL RD | 28 |
| NORTH OCEAN AVE | 28 |
| VILLAGE DR | 28 |
| JAYNE AVE | 22 |
| JENNINGS AVE | 22 |
| ROE BLVD W | 22 |
| WASHINGTON AVE | 22 |
| CARMAN ST | 20 |
| MONTAUK HWY | 20 |
| RAILROAD AVE | 20 |
| Other | 128 |
2003 - 2018 National Fire Incident Reporting System (NFIRS) incidents
- Incident types reported to NFIRS in Patchogue, NY
- 7,39247.8%Rescue & EMS
- 2,36515.3%False Alarm
- 2,34615.2%Hazardous Condition
- 1,76211.4%Fire
- 8685.6%Good Intent Call
- 6734.4%Service Call
- 250.2%Overpressure Rupture
- 200.1%Special Incident
- 180.1%Severe Weather
- Fire incident types reported to NFIRS in Patchogue, NY
- 84548.0%Structure Fires
- 61835.1%Outside Fires
- 21912.4%Mobile Property/Vehicle Fires
- 804.5%Other
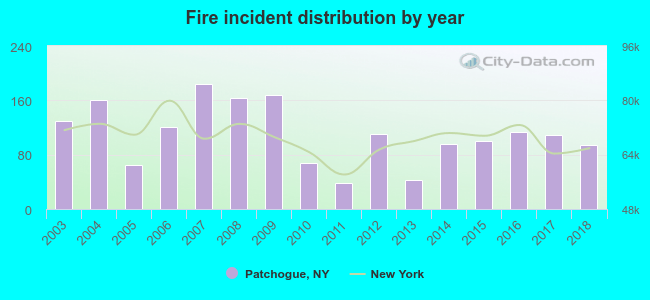 Based on the data from the years 2003 - 2018 the average number of fires per year is 110. The highest number of reported fire incidents - 184 took place in 2007, and the least - 38 in 2011. The data has a declining trend.
The average number of yearly fire incidents per 10k residents in Patchogue, NY compared to nearest cities:
(Note: Based on data for the last 3 years, including only cities with population 5,000 and above)
| Patchogue: | 85.5 |
| North Patchogue: | 2.3 |
| East Patchogue: | 22.5 |
| Bayport: | 7.1 |
| Sayville: | 13.4 |
| Holtsville: | 9.6 |
| Holbrook: | 12.7 |
| Medford: | 37.3 |
| Bohemia: | 32.1 |
 The median response time based on all reported fire incidents is 4 minutes. This is about the same as the state median value.
The median response time in Patchogue, NY compared to nearest cities:
(Note: Based on data for all years, including only cities with at least 500 fire incidents)
| Patchogue: | 4 minutes |
| East Patchogue: | 4 minutes |
| Holbrook: | 4 minutes |
| Bellport: | 5 minutes |
| Medford: | 4 minutes |
| Bohemia: | 4 minutes |
| Ronkonkoma: | 6 minutes |
| Selden: | 4 minutes |
| Shirley: | 7 minutes |
 According to the data from the years 2003 - 2018 the average number of fire-related yearly casualties is 1. The highest number of reported casualties - 4 took place in 2008, and the lowest - 0 in 2005. The data has a decreasing trend.
The average number of injuries per 1,000 fires is 5. This indicator was the highest - 25 in 2008, and the lowest 0 in 2005. The trend for casualties per 1,000 fires is decreasing. Compared to the state value the number of casualties per 1,000 fire incidents is lower.
According to the data from the years 2003 - 2018 the average number of fire-related yearly casualties is 1. The highest number of reported casualties - 4 took place in 2008, and the lowest - 0 in 2005. The data has a decreasing trend.
The average number of injuries per 1,000 fires is 5. This indicator was the highest - 25 in 2008, and the lowest 0 in 2005. The trend for casualties per 1,000 fires is decreasing. Compared to the state value the number of casualties per 1,000 fire incidents is lower.Casualties per 1,000 incidents in Patchogue, NY compared to nearest cities:
(Note: Based on data for all years, including only cities with at least 500 fire incidents)
| Patchogue: | 6.2 |
| East Patchogue: | 1.5 |
| Holbrook: | 9.9 |
| Bellport: | 0.0 |
| Medford: | 0.9 |
| Bohemia: | 0.0 |
| Ronkonkoma: | 7.7 |
| Selden: | 1.1 |
| Shirley: | 1.6 |
 27.6% incidents where reported in the morning and 72.4% in the evening. The most fires (16.1%) took place on Sunday, and the least (12.3%) on Wednesday.
 According to the 1,762 reports from years 2003 - 2018 most fires (11.5%) took place during April, and the least (6.3%) in October.
 Out of all 15,469 cases reported during the years 2003 - 2018, the most belonged to the categories: Rescue & EMS (47.8%), False Alarm (15.3%), and Hazardous Condition (15.2%).
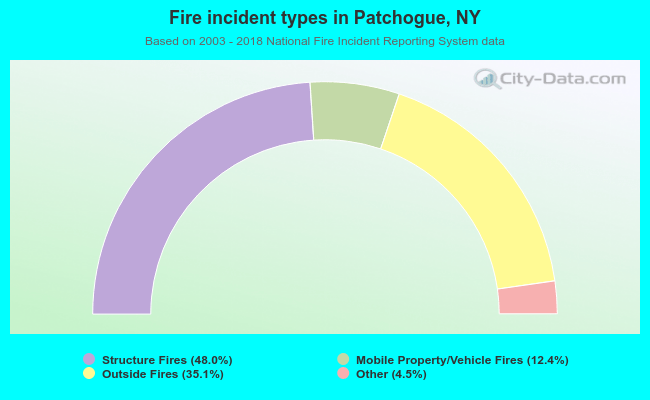 When looking into fire subcategories, the most incidents belonged to: Structure Fires (48.0%), and Outside Fires (35.1%).