Seabrook: Fire Incidents, New Hampshire (NH)
Where are fire incidents reported in Seabrook, NH
Something went wrong! Please refresh the page.
|
| |||||||||||||||||||||||||||||||||||||||||||||||||||||||||||||||||||||||||||||||||||||||||||||||||||||||||||||
2004 - 2018 National Fire Incident Reporting System (NFIRS) incidents
- Incident types reported to NFIRS in Seabrook, NH
- 5,28078.1%Rescue & EMS
- 4696.9%False Alarm
- 3415.0%Service Call
- 2824.2%Fire
- 2163.2%Hazardous Condition
- 1622.4%Good Intent Call
- 80.1%Special Incident
- Fire incident types reported to NFIRS in Seabrook, NH
- 10938.7%Structure Fires
- 9634.0%Outside Fires
- 5218.4%Other
- 258.9%Mobile Property/Vehicle Fires
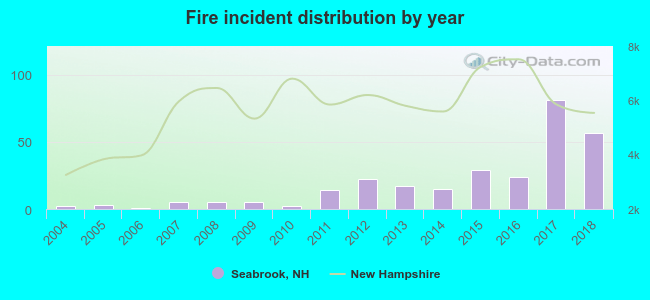 Based on the data from the years 2004 - 2018 the average number of fires per year is 19. The highest number of reported fires - 81 took place in 2017, and the least - 1 in 2006. The data has a rising trend.
The average number of yearly fire incidents per 10k residents in Seabrook, NH compared to nearest cities:
(Note: Based on data for the last 3 years, including only cities with population 5,000 and above)
| Seabrook: | 62.1 |
| Hampton: | 65.2 |
| Exeter: | 59.2 |
| Stratham: | 53.3 |
| Rye: | 37.8 |
| Kingston: | 52.6 |
| Plaistow: | 47.3 |
| Portsmouth: | 34.1 |
| Newmarket: | 32.1 |
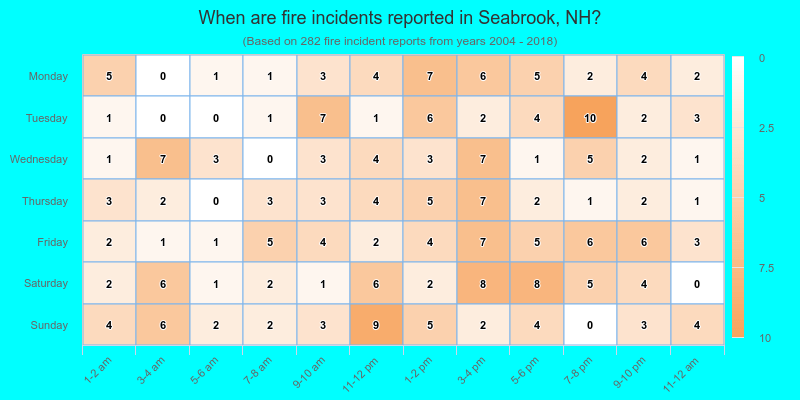
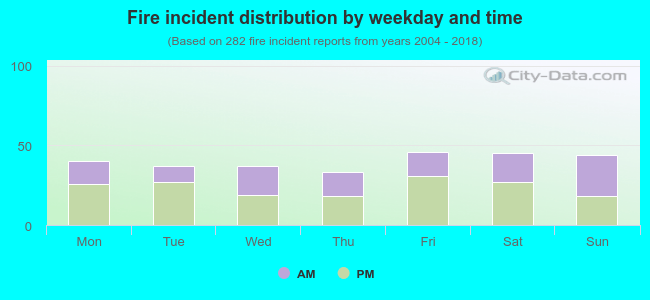 41.1% incidents where reported in the morning and 58.9% in the evening. The most fires (16.3%) took place on Friday, and the least (11.7%) on Thursday.
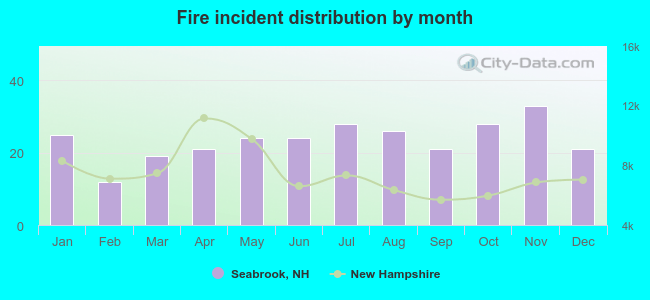 Based on the 282 fire incident reports from years 2004 - 2018 most fires (11.7%) took place during November, and the least (4.3%) in February.
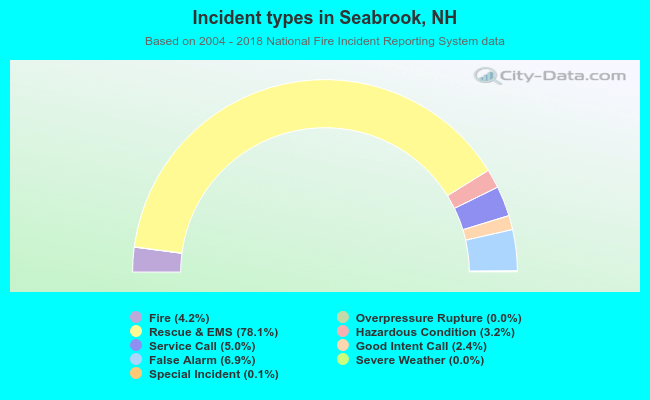 Out of all 6,761 cases reported during the years 2004 - 2018, the most belonged to the categories: Rescue & EMS (78.1%), False Alarm (6.9%), and Service Call (5.0%).
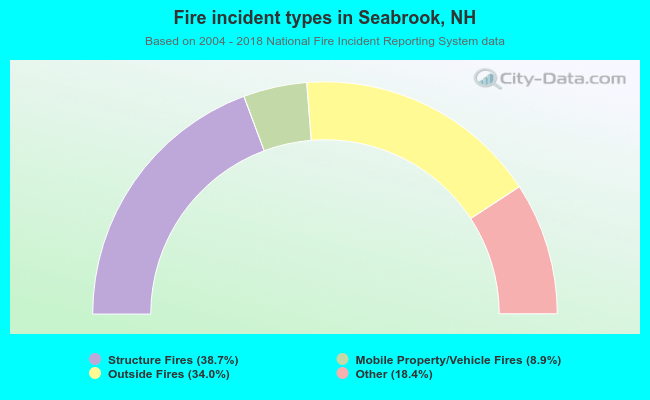 When looking into fire subcategories, the most reports belonged to: Structure Fires (38.7%), and Outside Fires (34.0%).