Hampton: Fire Incidents, New Hampshire (NH)
Where are fire incidents reported in Hampton, NH
Something went wrong! Please refresh the page.
| Fire incidents reported | |
|---|---|
| Sreet name | Count |
| OCEAN BLVD | 304 |
| LAFAYETTE RD | 284 |
| WINNACUNNET RD | 166 |
| ASHWORTH AVE | 106 |
| HIGH ST | 54 |
| ROUTE 95 | 40 |
| BROWN AVE | 36 |
| ROUTE 101 | 30 |
| MILL RD | 26 |
| DEARBORN AVE | 22 |
| EXETER RD | 22 |
| LANDING RD | 20 |
| TOWLE FARM RD | 20 |
| NORTH SHORE RD | 18 |
| C ST | 14 |
| DRAKESIDE RD | 14 |
| L ST | 14 |
| M ST | 14 |
| ALUMNI DR | 12 |
| DOVER AVE | 12 |
| F ST | 10 |
| HARBOR RD | 10 |
| I-95 | 10 |
| J ST | 10 |
| LAFAYETTE ROAD | 10 |
| LOCKE RD | 10 |
| OLD STAGE RD | 10 |
| RIVERVIEW TER | 10 |
| ATLANTIC AVE | 8 |
| CAROLAN AVE | 8 |
2002 - 2018 National Fire Incident Reporting System (NFIRS) incidents
- Incident types reported to NFIRS in Hampton, NH
- 6,16449.2%Rescue & EMS
- 2,13517.0%Hazardous Condition
- 1,35610.8%Service Call
- 1,30210.4%False Alarm
- 9947.9%Fire
- 4683.7%Good Intent Call
- 490.4%Severe Weather
- 340.3%Overpressure Rupture
- 230.2%Special Incident
- Fire incident types reported to NFIRS in Hampton, NH
- 57457.7%Structure Fires
- 20921.0%Outside Fires
- 12012.1%Mobile Property/Vehicle Fires
- 919.2%Other
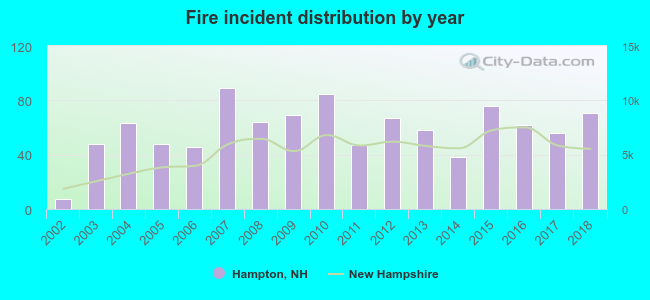 Based on the data from the years 2002 - 2018 the average number of fire incidents per year is 58. The highest number of reported fire incidents - 89 took place in 2007, and the least - 7 in 2002. The data has a rising trend.
The average number of yearly fire incidents per 10k residents in Hampton, NH compared to nearest cities:
(Note: Based on data for the last 3 years, including only cities with population 5,000 and above)
| Hampton: | 65.2 |
| Seabrook: | 62.1 |
| Rye: | 37.8 |
| Stratham: | 53.3 |
| Exeter: | 59.2 |
| Portsmouth: | 34.1 |
| Newmarket: | 32.1 |
| Kingston: | 52.6 |
| Durham: | 42.2 |
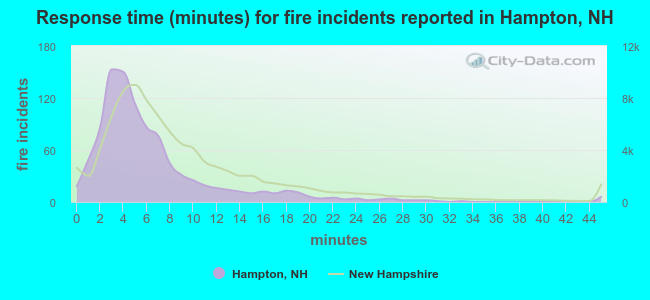 The median response time based on all reported fire incidents is 5 minutes. This is lower than the state median value.
The median response time in Hampton, NH compared to nearest cities:
(Note: Based on data for all years, including only cities with at least 500 fire incidents)
| Hampton: | 5 minutes |
| Exeter: | 6 minutes |
| Salisbury: | 4 minutes |
| Amesbury: | 5 minutes |
| Portsmouth: | 6 minutes |
| Merrimac: | 5 minutes |
| Epping: | 9 minutes |
| Durham: | 4 minutes |
| Rowley: | 7 minutes |
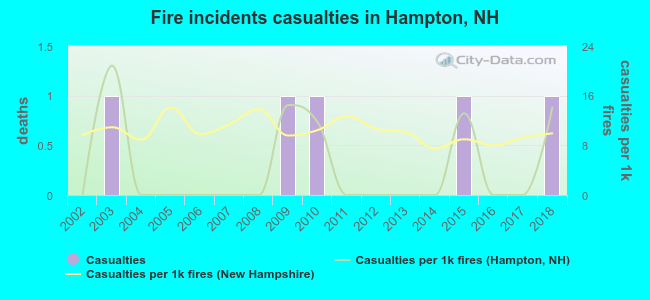 Based on the data from the years 2002 - 2018 the average number of fire-related casualties per year is 0. The highest number of injuries - 1 took place in 2003, and the lowest - 0 in 2002. The data has an increasing trend.
The average number of injuries per 1,000 fire incidents is 4. This indicator was the highest - 21 in 2003, and the lowest 0 in 2002. The trend for injuries per 1,000 incidents is growing. Compared to the New Hampshire value the number of injuries per 1,000 fire incidents is much lower.
Based on the data from the years 2002 - 2018 the average number of fire-related casualties per year is 0. The highest number of injuries - 1 took place in 2003, and the lowest - 0 in 2002. The data has an increasing trend.
The average number of injuries per 1,000 fire incidents is 4. This indicator was the highest - 21 in 2003, and the lowest 0 in 2002. The trend for injuries per 1,000 incidents is growing. Compared to the New Hampshire value the number of injuries per 1,000 fire incidents is much lower.
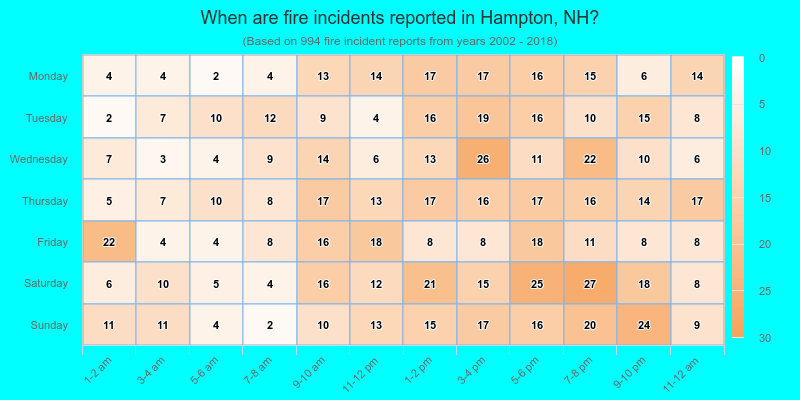
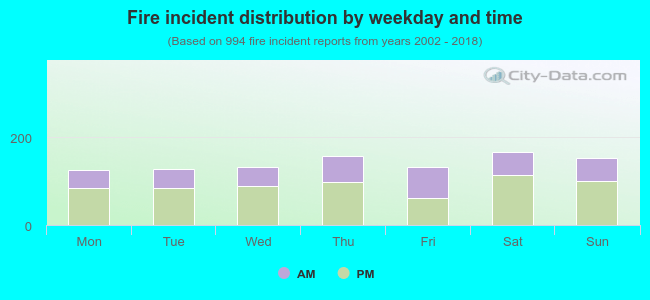 36.6% incidents where reported in the morning and 63.4% in the evening. The most fires (16.8%) took place on Saturday, and the least (12.7%) on Monday.
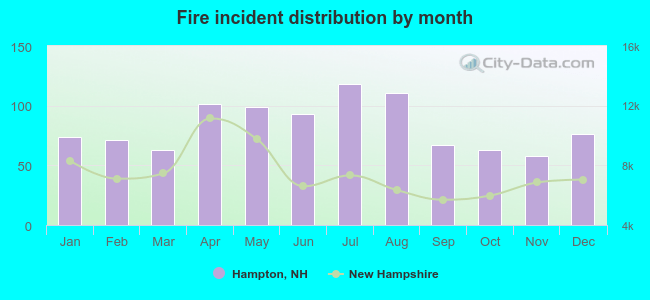 According to the 994 fire incident reports from years 2002 - 2018 most fires (11.9%) took place during July, and the least (5.8%) in November.
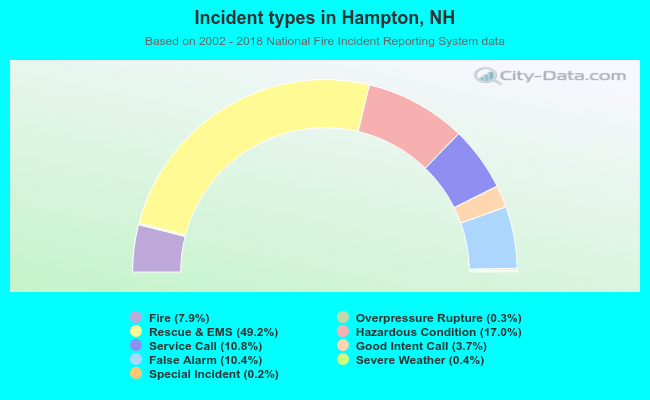 Out of all 12,525 cases reported during the years 2002 - 2018, the most belonged to the categories: Rescue & EMS (49.2%), Hazardous Condition (17.0%), and Service Call (10.8%).
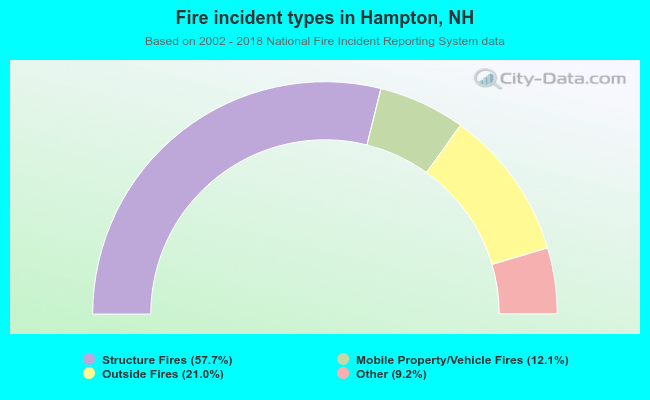 When looking into fire subcategories, the most reports belonged to: Structure Fires (57.7%), and Outside Fires (21.0%).