Selinsgrove: Fire Incidents, Pennsylvania (PA)
Where are fire incidents reported in Selinsgrove, PA
Something went wrong! Please refresh the page.
|
| |||||||||||||||||||||||||||||||||||||||||||||||||||||||||||||||||||||||||||||||||||||||||||||||||||||||||||||
2003 - 2018 National Fire Incident Reporting System (NFIRS) incidents
- Incident types reported to NFIRS in Selinsgrove, PA
- 17027.9%Rescue & EMS
- 13321.8%Hazardous Condition
- 13221.6%Fire
- 579.3%Service Call
- 487.9%Good Intent Call
- 447.2%False Alarm
- 233.8%Severe Weather
- 20.3%Special Incident
- 10.2%Overpressure Rupture
- Fire incident types reported to NFIRS in Selinsgrove, PA
- 10277.3%Structure Fires
- 1914.4%Outside Fires
- 75.3%Other
- 43.0%Mobile Property/Vehicle Fires
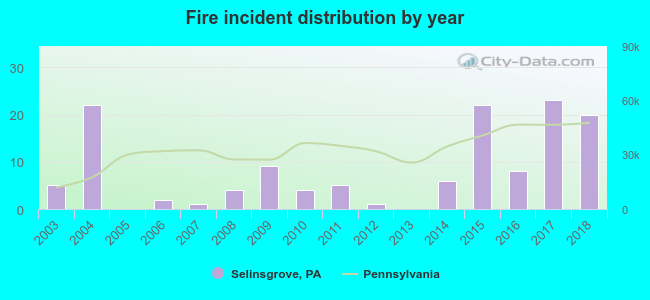 According to the data from the years 2003 - 2018 the average number of fire incidents per year is 8. The highest number of fires - 23 took place in 2017, and the least - 0 in 2005. The data has an increasing trend.
The average number of yearly fire incidents per 10k residents in Selinsgrove, PA compared to nearest cities:
(Note: Based on data for the last 3 years, including only cities with population 5,000 and above)
| Selinsgrove: | 29.4 |
| Sunbury: | 34.9 |
| Lewisburg: | 39.8 |
| Milton: | 30.6 |
| Shamokin: | 38.7 |
| Mount Carmel: | 32.8 |

 35.6% incidents where reported in the morning and 64.4% in the evening. The most fires (18.2%) took place on Saturday, and the least (11.4%) on Wednesday.
 According to the 132 fire incident reports from years 2003 - 2018 most fires (16.7%) took place during May, and the least (3.0%) in October.
 Out of all 610 cases reported during the years 2003 - 2018, the most belonged to the categories: Rescue & EMS (27.9%), Hazardous Condition (21.8%), and Fire (21.6%).
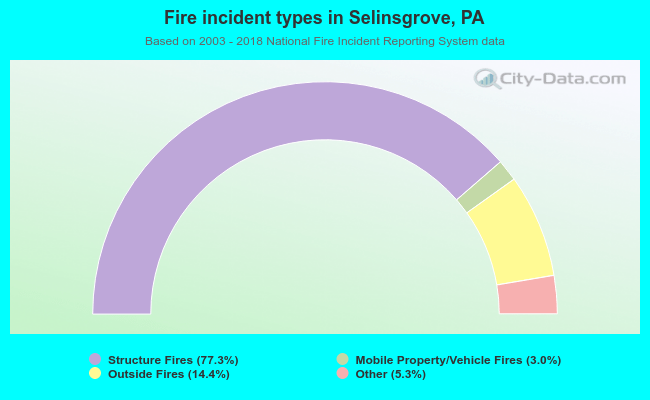 When looking into fire subcategories, the most incidents belonged to: Structure Fires (77.3%), and Outside Fires (14.4%).