Lewisburg: Fire Incidents, Pennsylvania (PA)
Where are fire incidents reported in Lewisburg, PA
Something went wrong! Please refresh the page.
|
| |||||||||||||||||||||||||||||||||||||||||||||||||||||||||||||||||||||||||||||||||||||||||||||||||||||||||||||
2006 - 2018 National Fire Incident Reporting System (NFIRS) incidents
- Incident types reported to NFIRS in Lewisburg, PA
- 1,00764.2%Rescue & EMS
- 25916.5%Fire
- 1217.7%Hazardous Condition
- 795.0%Service Call
- 493.1%Good Intent Call
- 493.1%False Alarm
- 20.1%Overpressure Rupture
- 20.1%Special Incident
- Fire incident types reported to NFIRS in Lewisburg, PA
- 15660.2%Structure Fires
- 4918.9%Outside Fires
- 2911.2%Other
- 259.7%Mobile Property/Vehicle Fires
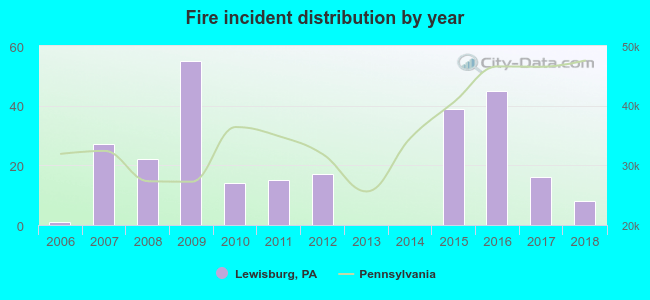 According to the data from the years 2006 - 2018 the average number of fire incidents per year is 20. The highest number of reported fire incidents - 55 took place in 2009, and the least - 0 in 2013. The data has a rising trend.
The average number of yearly fire incidents per 10k residents in Lewisburg, PA compared to nearest cities:
(Note: Based on data for the last 3 years, including only cities with population 5,000 and above)
| Lewisburg: | 39.8 |
| Milton: | 30.6 |
| Sunbury: | 34.9 |
| Selinsgrove: | 29.4 |
| South Williamsport: | 14.2 |
| Williamsport: | 29.2 |
| Shamokin: | 38.7 |
| Bloomsburg: | 66.1 |

 43.2% incidents where reported in the morning and 56.8% in the evening. The most fires (17.0%) took place on Sunday, and the least (7.3%) on Monday.
 Based on the 259 fire incident reports from years 2006 - 2018 most fires (13.5%) took place during August, and the least (3.1%) in October.
 Out of all 1,568 cases reported during the years 2006 - 2018, the most belonged to the categories: Rescue & EMS (64.2%), Fire (16.5%), and Hazardous Condition (7.7%).
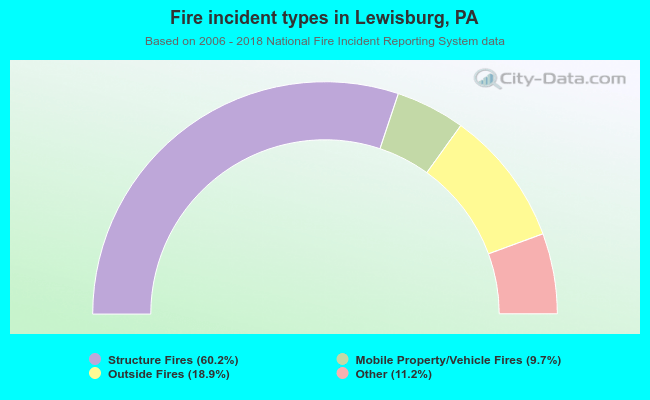 When looking into fire subcategories, the most incidents belonged to: Structure Fires (60.2%), and Outside Fires (18.9%).