Columbus: Fire Incidents, Indiana (IN)
Where are fire incidents reported in Columbus, IN
Something went wrong! Please refresh the page.
| Fire incidents reported | |
|---|---|
| Sreet name | Count |
| NATIONAL RD | 170 |
| 200 | 126 |
| US 31 | 120 |
| JONESVILLE RD | 100 |
| I65 | 96 |
| 25TH ST | 74 |
| PATTERSON ST | 72 |
| MARR RD | 70 |
| STATE ST | 70 |
| 250 | 66 |
| CALIFORNIA ST | 66 |
| I 65 | 64 |
| 500 | 60 |
| DEAVER RD | 60 |
| 25 TH ST | 58 |
| CENTRAL AVE | 56 |
| 100 | 54 |
| DELLA RD | 52 |
| OLD NASHVILLE RD | 52 |
| STATE ROAD 58 | 52 |
| 50 | 48 |
| PEARL ST | 48 |
| 300 | 44 |
| 400 | 44 |
| 550 | 44 |
| GRANDVIEW DR | 44 |
| GEORGETOWN RD | 42 |
| INWOOD DR | 42 |
| WASHINGTON ST | 42 |
| DAWSON ST | 40 |
| Other | 2,245 |
2002 - 2018 National Fire Incident Reporting System (NFIRS) incidents
- Incident types reported to NFIRS in Columbus, IN
- 8,28535.7%Good Intent Call
- 4,29818.5%Rescue & EMS
- 4,22118.2%Fire
- 3,80016.4%Hazardous Condition
- 1,3635.9%False Alarm
- 1,1074.8%Service Call
- 600.3%Special Incident
- 510.2%Severe Weather
- 240.1%Overpressure Rupture
- Fire incident types reported to NFIRS in Columbus, IN
- 1,79142.4%Outside Fires
- 1,58037.4%Structure Fires
- 64715.3%Mobile Property/Vehicle Fires
- 2034.8%Other
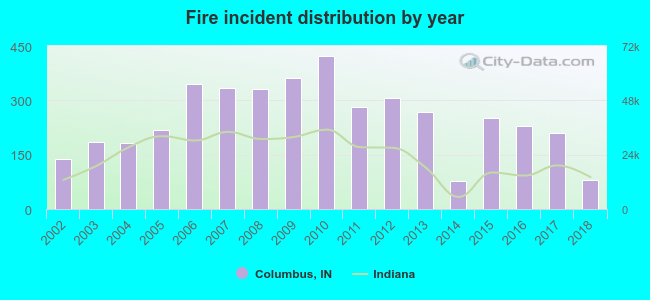 According to the data from the years 2002 - 2018 the average number of fires per year is 248. The highest number of fires - 423 took place in 2010, and the least - 78 in 2014. The data has a declining trend.
The average number of yearly fire incidents per 10k residents in Columbus, IN compared to nearest cities:
(Note: Based on data for the last 3 years, including only cities with population 5,000 and above)
| Columbus: | 37.4 |
| Seymour: | 27.2 |
| Franklin: | 20.0 |
| North Vernon: | 104.0 |
| Shelbyville: | 38.1 |
| Greensburg: | 53.0 |
| Bargersville: | 39.2 |
| New Whiteland: | 22.9 |
| Greenwood: | 12.8 |
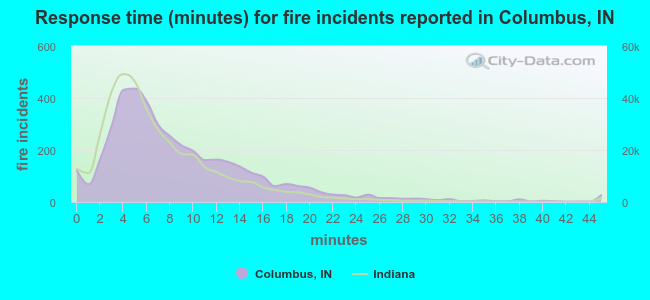 The median response time based on all reported fire incidents is 7 minutes. This is about the same as the Indiana median value.
The median response time in Columbus, IN compared to nearest cities:
(Note: Based on data for all years, including only cities with at least 500 fire incidents)
| Columbus: | 7 minutes |
| Edinburgh: | 7 minutes |
| Nashville: | 12 minutes |
| Seymour: | 4 minutes |
| Franklin: | 4 minutes |
| North Vernon: | 9 minutes |
| Shelbyville: | 5 minutes |
| Greensburg: | 6 minutes |
| Bargersville: | 7 minutes |
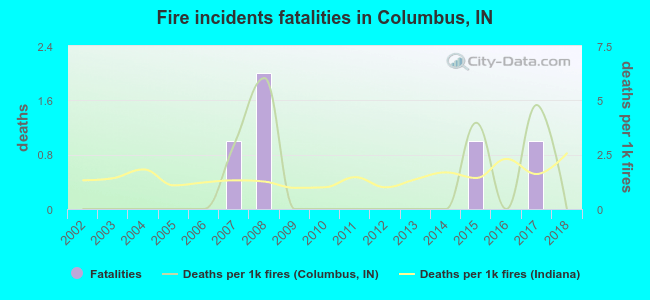 Based on the data from the years 2002 - 2018 the average number of fire-related yearly deaths is 0. The highest number of deaths - 2 took place in 2008, and the lowest - 0 in 2002. The data has a constant trend.
The average number of deaths per 1,000 fire incidents is 1. This indicator was the highest - 6 in 2008, and the lowest 0 in 2002. The trend for deaths per 1,000 incidents is constant. Compared to the Indiana value the number of fatalities per 1,000 fires is about the same.
Based on the data from the years 2002 - 2018 the average number of fire-related yearly deaths is 0. The highest number of deaths - 2 took place in 2008, and the lowest - 0 in 2002. The data has a constant trend.
The average number of deaths per 1,000 fire incidents is 1. This indicator was the highest - 6 in 2008, and the lowest 0 in 2002. The trend for deaths per 1,000 incidents is constant. Compared to the Indiana value the number of fatalities per 1,000 fires is about the same.Deaths per 1,000 incidents in Columbus, IN compared to nearest cities:
(Note: Based on data for all years, including only cities with at least 2,500 fire incidents)
| Columbus: | 1.2 |
| Greenwood: | 0.3 |
| Bloomington: | 1.1 |
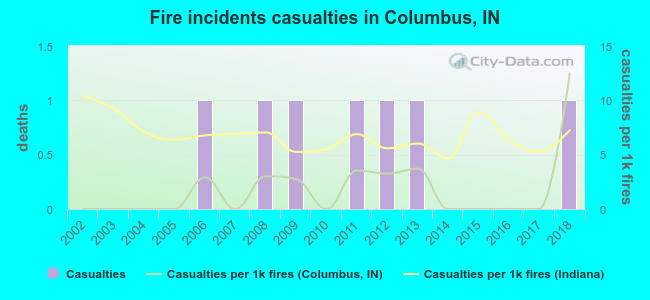 Based on the reports from the years 2002 - 2018 the average number of fire-related casualties per year is 0. The highest number of reported casualties - 1 took place in 2006, and the lowest - 0 in 2002. The data has a growing trend.
The average number of injuries per 1,000 fire incidents is 2. This indicator was the highest - 13 in 2018, and the lowest 0 in 2002. The trend for injuries per 1,000 fires is rising. Compared to the state value the number of casualties per 1,000 fires is much lower.
Based on the reports from the years 2002 - 2018 the average number of fire-related casualties per year is 0. The highest number of reported casualties - 1 took place in 2006, and the lowest - 0 in 2002. The data has a growing trend.
The average number of injuries per 1,000 fire incidents is 2. This indicator was the highest - 13 in 2018, and the lowest 0 in 2002. The trend for injuries per 1,000 fires is rising. Compared to the state value the number of casualties per 1,000 fires is much lower.Casualties per 1,000 incidents in Columbus, IN compared to nearest cities:
(Note: Based on data for all years, including only cities with at least 500 fire incidents)
| Columbus: | 1.7 |
| Edinburgh: | 5.3 |
| Nashville: | 4.3 |
| Seymour: | 0.6 |
| Franklin: | 0.8 |
| North Vernon: | 0.0 |
| Shelbyville: | 9.9 |
| Greensburg: | 5.6 |
| Bargersville: | 7.1 |
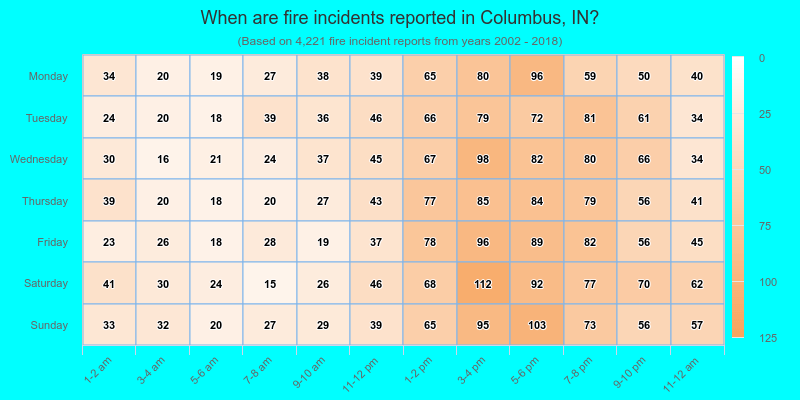
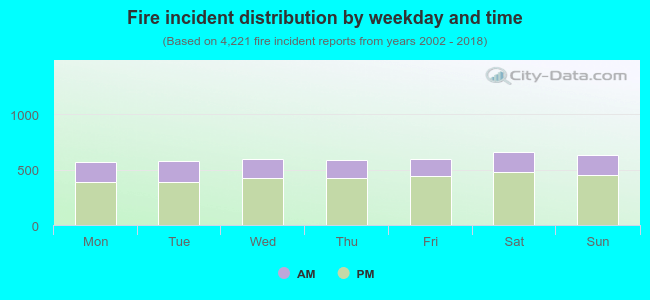 28.7% incidents where reported in the morning and 71.3% in the evening. The most fires (15.7%) took place on Saturday, and the least (13.4%) on Monday.
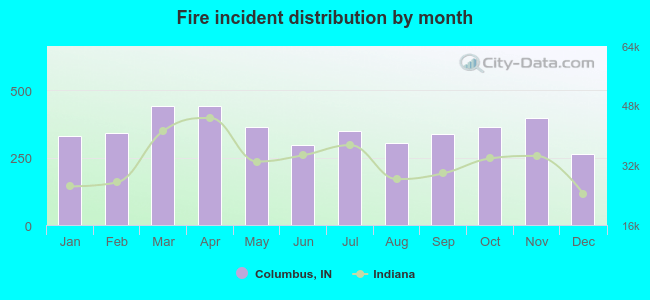 According to the 4,221 reports from years 2002 - 2018 most fires (10.5%) took place during March, and the least (6.2%) in December.
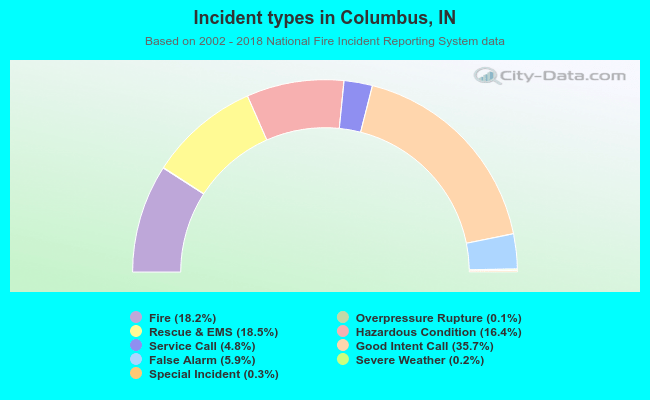 Out of all 23,209 cases reported during the years 2002 - 2018, the most belonged to the categories: Good Intent Call (35.7%), Rescue & EMS (18.5%), and Fire (18.2%).
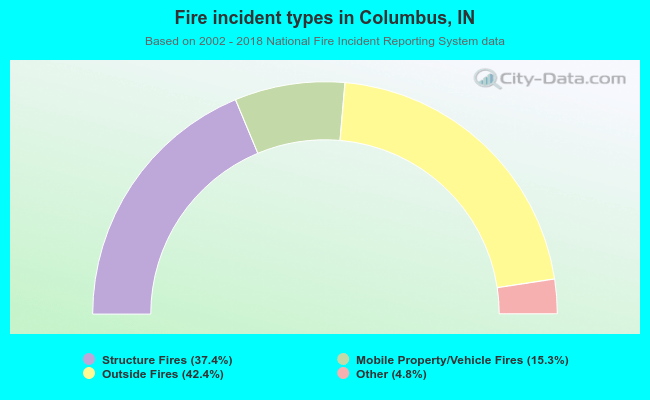 When looking into fire subcategories, the most incidents belonged to: Outside Fires (42.4%), and Structure Fires (37.4%).