Shakopee: Fire Incidents, Minnesota (MN)
Where are fire incidents reported in Shakopee, MN
Something went wrong! Please refresh the page.
| Fire incidents reported | |
|---|---|
| Sreet name | Count |
| HIGHWAY 169 | 184 |
| COUNTY ROAD 101 | 130 |
| 4TH AVE | 102 |
| CANTERBURY RD | 100 |
| EAGLE CREEK BLVD | 100 |
| 1ST AVE | 96 |
| JOHNSON MEMORIAL DR | 88 |
| VALLEY INDUSTRIAL BLVD | 78 |
| GORMAN ST | 70 |
| 12TH AVE | 60 |
| 3RD AVE | 60 |
| CHESTNUT BLVD | 46 |
| MARSCHALL RD | 46 |
| SARAZIN ST | 44 |
| OXFORD RD | 42 |
| SHAKOPEE AVE | 40 |
| TAYLOR ST | 40 |
| 17TH AVE | 38 |
| DAKOTA ST | 38 |
| VIERLING DR | 38 |
| MARYSTOWN RD | 34 |
| STAGECOACH RD | 34 |
| ROUNDHOUSE ST | 32 |
| OLD CARRIAGE CT | 30 |
| GARDEN LN | 28 |
| VALLEYFAIR DR | 28 |
| 10TH AVE | 26 |
| OLD BRICKYARD RD | 26 |
| 13TH AVE | 24 |
| MARAS ST | 24 |
| Other | 19 |
2002 - 2018 National Fire Incident Reporting System (NFIRS) incidents
- Incident types reported to NFIRS in Shakopee, MN
- 1,74526.2%Fire
- 1,39320.9%Hazardous Condition
- 1,34020.1%Rescue & EMS
- 1,14717.2%False Alarm
- 75111.3%Good Intent Call
- 2273.4%Service Call
- 500.7%Overpressure Rupture
- 200.3%Severe Weather
- Fire incident types reported to NFIRS in Shakopee, MN
- 87850.3%Structure Fires
- 52630.1%Outside Fires
- 33219.0%Mobile Property/Vehicle Fires
- 90.5%Other
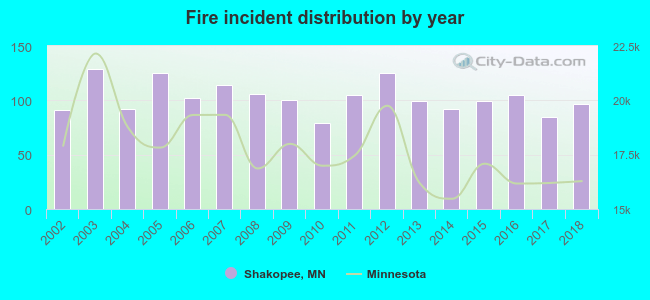 Based on the data from the years 2002 - 2018 the average number of fires per year is 103. The highest number of fire incidents - 129 took place in 2003, and the least - 79 in 2010. The data has a growing trend.
The average number of yearly fire incidents per 10k residents in Shakopee, MN compared to nearest cities:
(Note: Based on data for the last 3 years, including only cities with population 5,000 and above)
| Shakopee: | 24.1 |
| Chaska: | 13.6 |
| Eden Prairie: | 15.2 |
| Prior Lake: | 22.2 |
| Chanhassen: | 11.3 |
| Savage: | 9.7 |
| Shorewood: | 10.6 |
| Victoria: | 14.3 |
| Bloomington: | 21.2 |
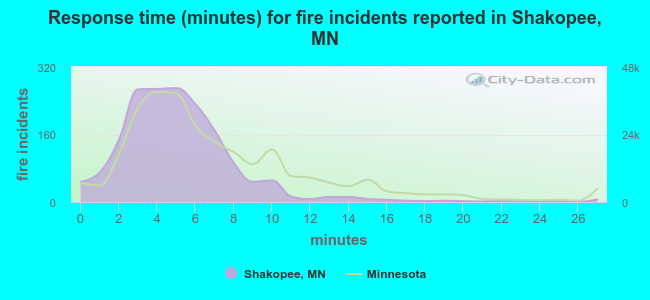 The median response time based on all reported fire incidents is 5 minutes. This is lower than the Minnesota median value.
The median response time in Shakopee, MN compared to nearest cities:
(Note: Based on data for all years, including only cities with at least 500 fire incidents)
| Shakopee: | 5 minutes |
| Chaska: | 4 minutes |
| Eden Prairie: | 6 minutes |
| Prior Lake: | 4 minutes |
| Savage: | 5 minutes |
| Bloomington: | 5 minutes |
| Minnetonka: | 7 minutes |
| Edina: | 5 minutes |
| Hopkins: | 5 minutes |
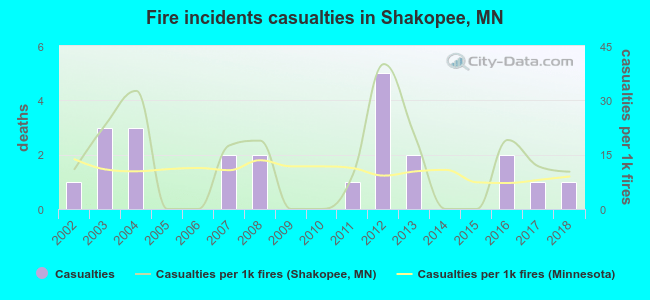 According to the data from the years 2002 - 2018 the average number of fire-related yearly casualties is 1. The highest number of casualties - 5 took place in 2012, and the lowest - 0 in 2005. The data has a constant trend.
The average number of injuries per 1,000 fires is 13. This indicator was the highest - 40 in 2012, and the lowest 0 in 2005. The trend for injuries per 1,000 fires is declining. Compared to the Minnesota value the number of injuries per 1,000 fires is higher.
According to the data from the years 2002 - 2018 the average number of fire-related yearly casualties is 1. The highest number of casualties - 5 took place in 2012, and the lowest - 0 in 2005. The data has a constant trend.
The average number of injuries per 1,000 fires is 13. This indicator was the highest - 40 in 2012, and the lowest 0 in 2005. The trend for injuries per 1,000 fires is declining. Compared to the Minnesota value the number of injuries per 1,000 fires is higher.Casualties per 1,000 incidents in Shakopee, MN compared to nearest cities:
(Note: Based on data for all years, including only cities with at least 500 fire incidents)
| Shakopee: | 13.2 |
| Chaska: | 1.4 |
| Eden Prairie: | 22.6 |
| Prior Lake: | 1.9 |
| Savage: | 11.5 |
| Bloomington: | 10.0 |
| Minnetonka: | 20.8 |
| Edina: | 40.5 |
| Hopkins: | 17.8 |
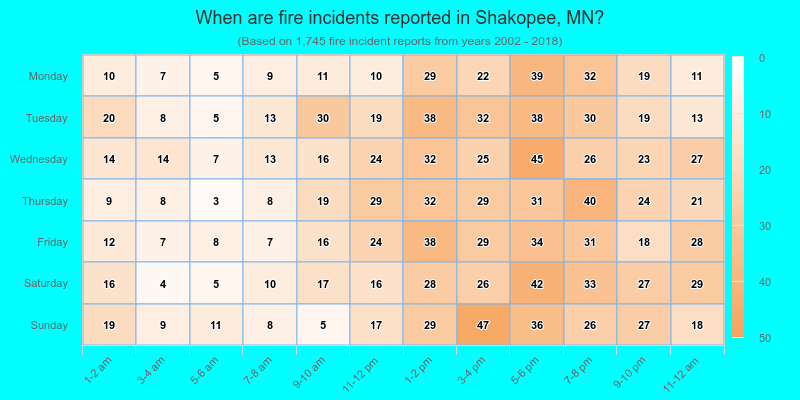
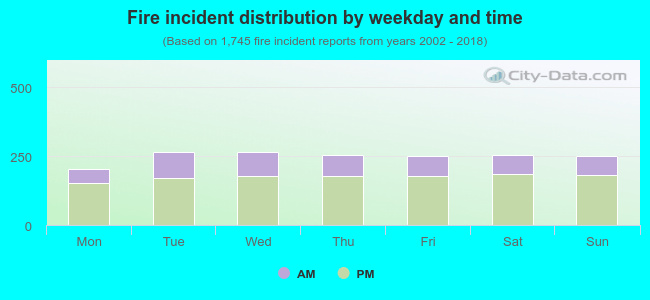 29.9% incidents where reported in the morning and 70.1% in the evening. The most fires (15.2%) took place on Wednesday, and the least (11.7%) on Monday.
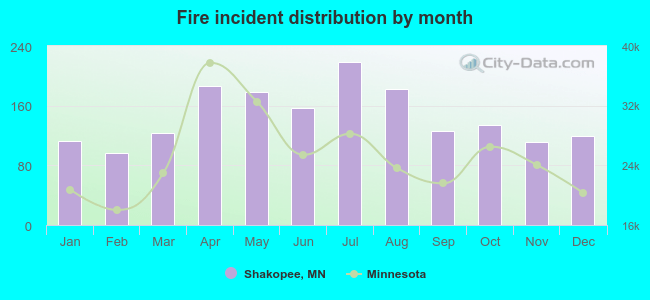 Based on the 1,745 reports from years 2002 - 2018 most fires (12.5%) took place during July, and the least (5.6%) in February.
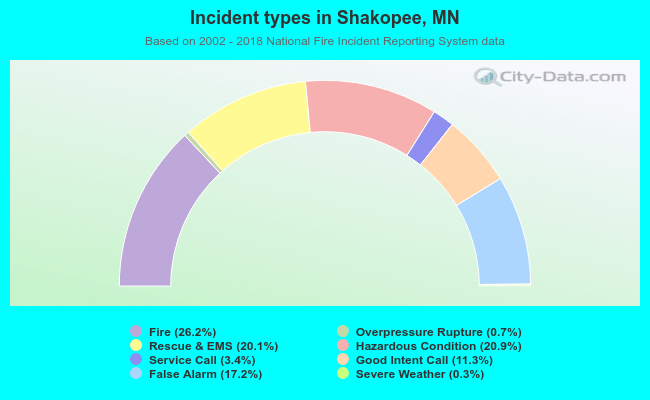 Out of all 6,673 cases reported during the years 2002 - 2018, the most belonged to the categories: Fire (26.2%), Hazardous Condition (20.9%), and Rescue & EMS (20.1%).
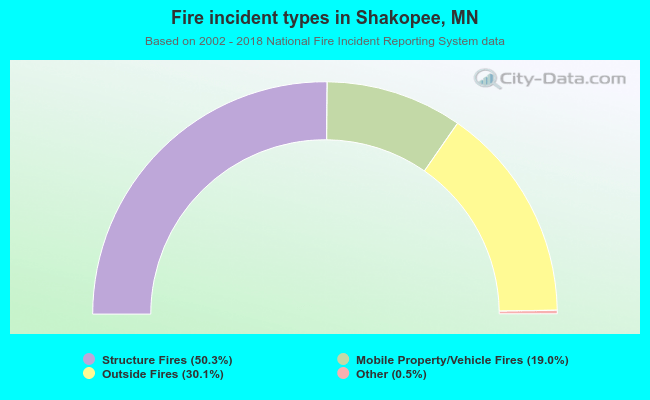 When looking into fire subcategories, the most incidents belonged to: Structure Fires (50.3%), and Outside Fires (30.1%).