Sheboygan: Fire Incidents, Wisconsin (WI)
Where are fire incidents reported in Sheboygan, WI
Something went wrong! Please refresh the page.
| Fire incidents reported | |
|---|---|
| Sreet name | Count |
| ERIE AVE | 118 |
| INDIANA AVE | 86 |
| 8TH ST | 80 |
| 12TH ST | 66 |
| WATER ST | 60 |
| SUPERIOR AVE | 52 |
| BUSINESS DR | 50 |
| TAYLOR DR | 50 |
| UNION AVE | 48 |
| 10TH ST | 46 |
| GEELE AVE | 42 |
| GEORGIA AVE | 42 |
| 11TH ST | 38 |
| 9TH ST | 38 |
| HURON AVE | 36 |
| EISNER AVE | 34 |
| NORTH AVE | 34 |
| ST CLAIR AVE | 34 |
| 14TH ST | 32 |
| 6TH ST | 30 |
| 7TH ST | 30 |
| MICHIGAN AVE | 30 |
| 15TH ST | 28 |
| 17TH ST | 28 |
| GATEWAY DR | 28 |
| ONTARIO AVE | 28 |
| PENNSYLVANIA AVE | 28 |
| 8 ST | 26 |
| INTERSTATE 43 | 26 |
| ALABAMA AVE | 24 |
| Other | 228 |
2002 - 2018 National Fire Incident Reporting System (NFIRS) incidents
- Incident types reported to NFIRS in Sheboygan, WI
- 19,00570.8%Rescue & EMS
- 2,2038.2%Service Call
- 1,6206.0%Hazardous Condition
- 1,5205.7%Fire
- 1,4025.2%False Alarm
- 9983.7%Good Intent Call
- 620.2%Overpressure Rupture
- Fire incident types reported to NFIRS in Sheboygan, WI
- 96163.2%Structure Fires
- 31120.5%Outside Fires
- 22414.7%Mobile Property/Vehicle Fires
- 241.6%Other
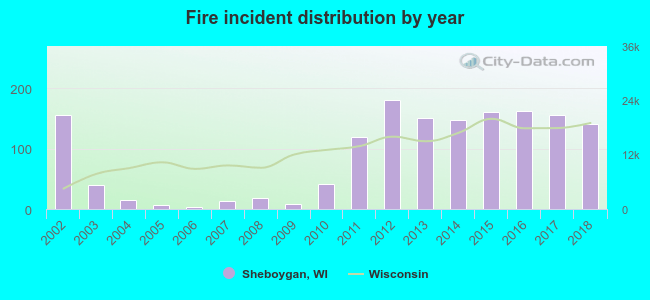 Based on the data from the years 2002 - 2018 the average number of fires per year is 89. The highest number of fire incidents - 180 took place in 2012, and the least - 4 in 2006. The data has a dropping trend.
The average number of yearly fire incidents per 10k residents in Sheboygan, WI compared to nearest cities:
(Note: Based on data for the last 3 years, including only cities with population 5,000 and above)
| Sheboygan: | 31.4 |
| Sheboygan Falls: | 75.9 |
| Plymouth: | 77.1 |
| Manitowoc: | 27.1 |
| Port Washington: | 19.9 |
| Two Rivers: | 34.1 |
| Grafton: | 15.9 |
| West Bend: | 28.4 |
| Cedarburg: | 15.9 |
 The median response time based on all reported fire incidents is 5 minutes. This is lower compared to the state median value.
The median response time in Sheboygan, WI compared to nearest cities:
(Note: Based on data for all years, including only cities with at least 500 fire incidents)
| Sheboygan: | 5 minutes |
| Plymouth: | 10 minutes |
| Manitowoc: | 5 minutes |
| Two Rivers: | 5 minutes |
| West Bend: | 5 minutes |
| Fond du Lac: | 5 minutes |
 According to the reports from the years 2002 - 2018 the average number of fire-related yearly deaths is 0. The highest number of reported deaths - 1 took place in 2002, and the lowest - 0 in 2003. The data has a declining trend.
 Based on the data from the years 2002 - 2018 the average number of fire-related casualties per year is 4. The highest number of reported injuries - 11 took place in 2014, and the lowest - 0 in 2004. The data has an increasing trend.
The average number of injuries per 1,000 fires is 34. This indicator was the highest - 111 in 2009, and the lowest 0 in 2004. The trend for injuries per 1,000 incidents is growing. Compared to the state value the number of injuries per 1,000 incidents is much higher.
Based on the data from the years 2002 - 2018 the average number of fire-related casualties per year is 4. The highest number of reported injuries - 11 took place in 2014, and the lowest - 0 in 2004. The data has an increasing trend.
The average number of injuries per 1,000 fires is 34. This indicator was the highest - 111 in 2009, and the lowest 0 in 2004. The trend for injuries per 1,000 incidents is growing. Compared to the state value the number of injuries per 1,000 incidents is much higher.Casualties per 1,000 incidents in Sheboygan, WI compared to nearest cities:
(Note: Based on data for all years, including only cities with at least 500 fire incidents)
| Sheboygan: | 39.5 |
| Plymouth: | 9.9 |
| Manitowoc: | 25.5 |
| Two Rivers: | 17.7 |
| West Bend: | 33.2 |
| Fond du Lac: | 4.7 |
 32.6% incidents where reported in the morning and 67.4% in the evening. The most fires (16.3%) took place on Monday, and the least (12.5%) on Tuesday.
 According to the 1,520 reports from years 2002 - 2018 most fires (10.3%) took place during October, and the least (6.4%) in February.
 Out of all 26,831 cases reported during the years 2002 - 2018, the most belonged to the categories: Rescue & EMS (70.8%), Service Call (8.2%), and Hazardous Condition (6.0%).
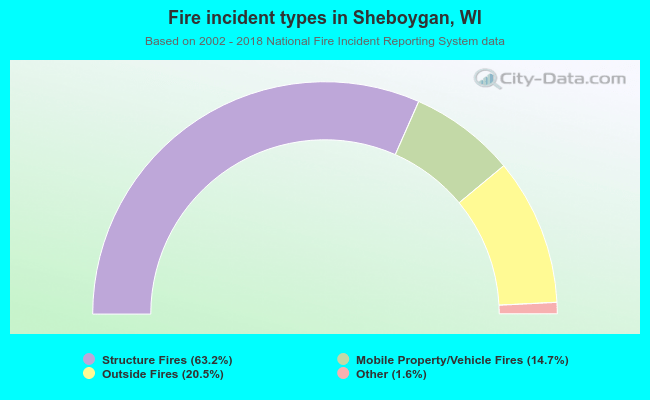 When looking into fire subcategories, the most reports belonged to: Structure Fires (63.2%), and Outside Fires (20.5%).