Cudahy: Fire Incidents, Wisconsin (WI)
Where are fire incidents reported in Cudahy, WI
Something went wrong! Please refresh the page.
| Fire incidents reported | |
|---|---|
| Sreet name | Count |
| PACKARD AVE | 234 |
| LAYTON AVE | 132 |
| LAKE DR | 100 |
| BARNARD AVE | 78 |
| RAMSEY AVE | 58 |
| EDGERTON AVE | 56 |
| GRANGE AVE | 54 |
| PENNSYLVANIA AVE | 46 |
| UNDERWOOD AVE | 46 |
| PULASKI AVE | 42 |
| PLANKINTON AVE | 38 |
| SQUIRE AVE | 36 |
| CUDAHY AVE | 32 |
| NICHOLSON AVE | 32 |
| WHITNALL AVE | 30 |
| BUCKHORN AVE | 28 |
| CARPENTER AVE | 28 |
| SHERIDAN DR | 28 |
| ADAMS AVE | 26 |
| SWEET APPLEWOOD LN | 26 |
| COLLEGE AVE | 24 |
| SWIFT AVE | 24 |
| VAN NORMAN AVE | 24 |
| SOMERS AVE | 22 |
| ADAMS CT | 20 |
| ARMOUR AVE | 20 |
| KIRKWOOD AVE | 20 |
| HOLMES AVE | 18 |
| ILLINOIS AVE | 18 |
| MARTIN AVE | 18 |
2002 - 2018 National Fire Incident Reporting System (NFIRS) incidents
- Incident types reported to NFIRS in Cudahy, WI
- 2,42449.2%Rescue & EMS
- 94519.2%Fire
- 80616.4%Hazardous Condition
- 3346.8%False Alarm
- 2735.5%Service Call
- 1252.5%Good Intent Call
- 90.2%Special Incident
- 60.1%Severe Weather
- Fire incident types reported to NFIRS in Cudahy, WI
- 53356.4%Structure Fires
- 22824.1%Outside Fires
- 929.7%Mobile Property/Vehicle Fires
- 929.7%Other
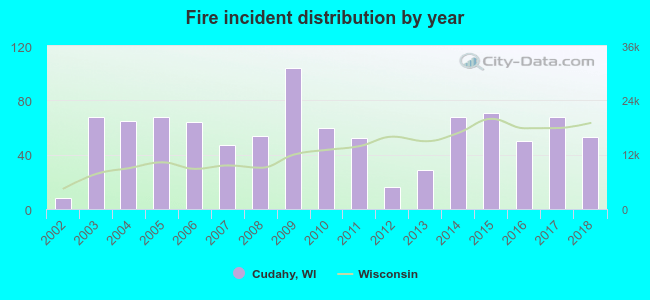 Based on the data from the years 2002 - 2018 the average number of fire incidents per year is 56. The highest number of fire incidents - 104 took place in 2009, and the least - 8 in 2002. The data has a growing trend.
The average number of yearly fire incidents per 10k residents in Cudahy, WI compared to nearest cities:
(Note: Based on data for the last 3 years, including only cities with population 5,000 and above)
| Cudahy: | 31.1 |
| South Milwaukee: | 23.5 |
| Oak Creek: | 30.0 |
| Greenfield: | 14.3 |
| Greendale: | 17.0 |
| Franklin: | 22.7 |
| Milwaukee: | 33.6 |
| West Allis: | 18.9 |
| Hales Corners: | 25.4 |
 The median response time based on all reported fire incidents is 3 minutes. This is much lower than the Wisconsin median value.
The median response time in Cudahy, WI compared to nearest cities:
(Note: Based on data for all years, including only cities with at least 500 fire incidents)
| Cudahy: | 3 minutes |
| South Milwaukee: | 3 minutes |
| Oak Creek: | 6 minutes |
| Greenfield: | 6 minutes |
| Franklin: | 6 minutes |
| Milwaukee: | 4 minutes |
| West Allis: | 4 minutes |
| Wauwatosa: | 6 minutes |
| New Berlin: | 7 minutes |
 Based on the reports from the years 2002 - 2018 the average number of fire-related yearly casualties is 0. The highest number of casualties - 3 took place in 2010, and the lowest - 0 in 2002. The data has a constant trend.
The average number of casualties per 1,000 fires is 8. This indicator was the highest - 50 in 2010, and the lowest 0 in 2002. The trend for injuries per 1,000 incidents is constant. Compared to the state value the number of casualties per 1,000 incidents is about the same.
Based on the reports from the years 2002 - 2018 the average number of fire-related yearly casualties is 0. The highest number of casualties - 3 took place in 2010, and the lowest - 0 in 2002. The data has a constant trend.
The average number of casualties per 1,000 fires is 8. This indicator was the highest - 50 in 2010, and the lowest 0 in 2002. The trend for injuries per 1,000 incidents is constant. Compared to the state value the number of casualties per 1,000 incidents is about the same.Casualties per 1,000 incidents in Cudahy, WI compared to nearest cities:
(Note: Based on data for all years, including only cities with at least 500 fire incidents)
| Cudahy: | 8.5 |
| South Milwaukee: | 18.4 |
| Oak Creek: | 15.1 |
| Greenfield: | 4.0 |
| Franklin: | 11.6 |
| Milwaukee: | 1.6 |
| West Allis: | 53.5 |
| Wauwatosa: | 28.7 |
| New Berlin: | 7.1 |
 33.0% incidents where reported in the morning and 67.0% in the evening. The most fires (16.0%) took place on Monday, and the least (12.3%) on Thursday.
 Based on the 945 fire incident reports from years 2002 - 2018 most fires (14.0%) took place during July, and the least (5.3%) in January.
 Out of all 4,926 cases reported during the years 2002 - 2018, the most belonged to the categories: Rescue & EMS (49.2%), Fire (19.2%), and Hazardous Condition (16.4%).
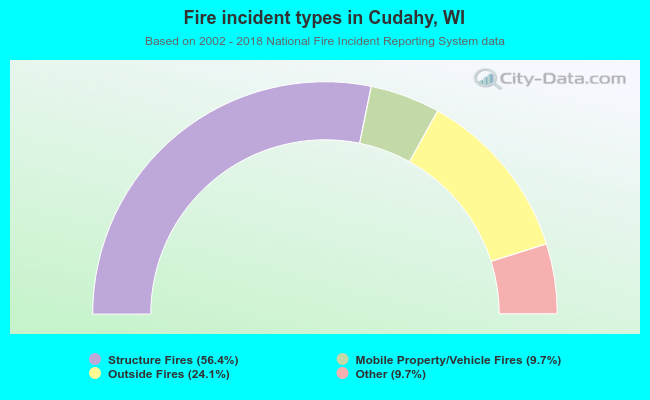 When looking into fire subcategories, the most reports belonged to: Structure Fires (56.4%), and Outside Fires (24.1%).