According to our research of Ohio and other state lists, there were 2 registered sex offenders living in Coal Grove, Ohio as of June 04, 2024. The ratio of all residents to sex offenders in Coal Grove is 944 to 1. The ratio of registered sex offenders to all residents in this city is lower than the state average.
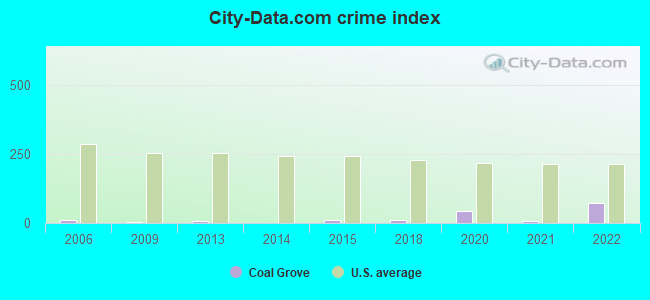
Crime rates in Coal Grove by year
Type
2009
2013
2014
2015
2018
2020
2021
2022
Murders (per 100,000)
0 (0.0)
0 (0.0)
0 (0.0)
0 (0.0)
0 (0.0)
0 (0.0)
0 (0.0)
0 (0.0)
Rapes (per 100,000)
0 (0.0)
0 (0.0)
0 (0.0)
0 (0.0)
0 (0.0)
0 (0.0)
0 (0.0)
1 (54.1)
Robberies (per 100,000)
0 (0.0)
0 (0.0)
0 (0.0)
0 (0.0)
0 (0.0)
0 (0.0)
0 (0.0)
0 (0.0)
Assaults (per 100,000)
0 (0.0)
1 (46.4)
0 (0.0)
1 (46.5)
1 (47.8)
4 (193.8)
0 (0.0)
1 (54.1)
Burglaries (per 100,000)
1 (48.3)
0 (0.0)
0 (0.0)
0 (0.0)
0 (0.0)
1 (48.4)
1 (49.1)
5 (270.7)
Thefts (per 100,000)
0 (0.0)
0 (0.0)
0 (0.0)
1 (46.5)
1 (47.8)
1 (48.4)
2 (98.1)
0 (0.0)
Auto thefts (per 100,000)
0 (0.0)
0 (0.0)
0 (0.0)
0 (0.0)
0 (0.0)
0 (0.0)
0 (0.0)
0 (0.0)
Arson (per 100,000)
0 (0.0)
0 (0.0)
0 (0.0)
0 (0.0)
0 (0.0)
0 (0.0)
0 (0.0)
0 (0.0)
City-Data.com crime index
3.4
9.3
0.0
11.2
11.5
44.1
7.4
73.1
The City-Data.com crime index weighs serious crimes and violent crimes more heavily. Higher means more crime, U.S. average is 246.1. It adjusts for the number of visitors and daily workers commuting into cities.
Latest news from Coal Grove, OH collected exclusively by city-data.com from local newspapers, TV, and radio stations
Ancestries: Irish (19.1%), German (14.1%), English (12.0%), American (6.4%), Scottish (2.4%), Welsh (1.2%).
Current Local Time: EST time zone
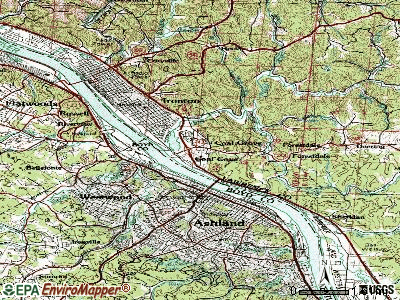
Elevation: 560 feet
Land area: 1.97 square miles.
Population density: 934 people per square mile (low).
Median real estate property taxes paid for housing units with mortgages in 2022: $1,211 (1.0%) Median real estate property taxes paid for housing units with no mortgage in 2022: $795 (0.9%)
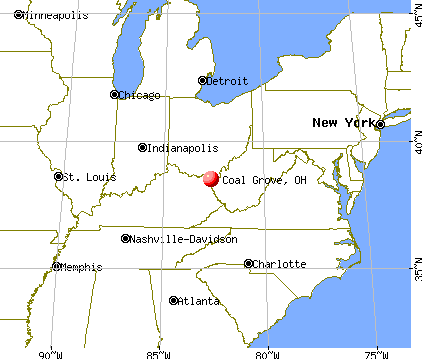
Nearest city with pop. 50,000+: Huntington, WV (13.0 miles , pop. 51,475).
Nearest city with pop. 200,000+: Columbus, OH (104.7 miles , pop. 711,470).
Nearest city with pop. 1,000,000+: Chicago, IL (352.2 miles , pop. 2,896,016).
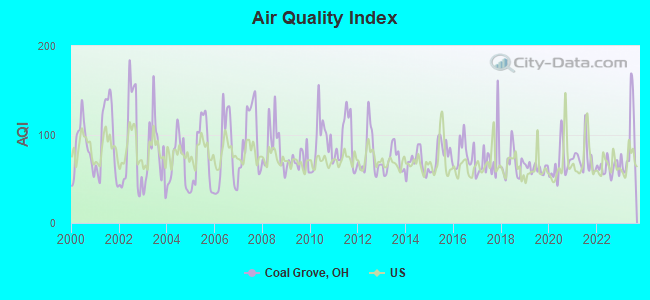
Air Quality Index (AQI) level in 2023 was 90.7. This is worse than average.
City:
90.7
U.S.:
72.6
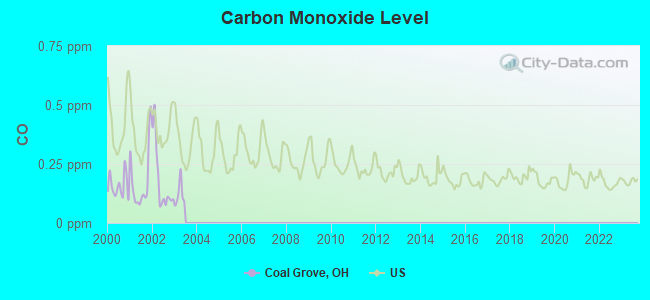
Carbon Monoxide (CO) [ppm] level in 2002 was 0.180. This is better than average.Closest monitor was 1.5 miles away from the city center.
City:
0.180
U.S.:
0.251
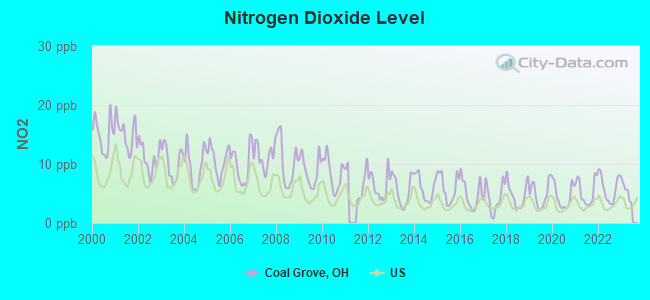
Nitrogen Dioxide (NO2) [ppb] level in 2022 was 5.87. This is about average.Closest monitor was 1.7 miles away from the city center.
City:
5.87
U.S.:
5.11
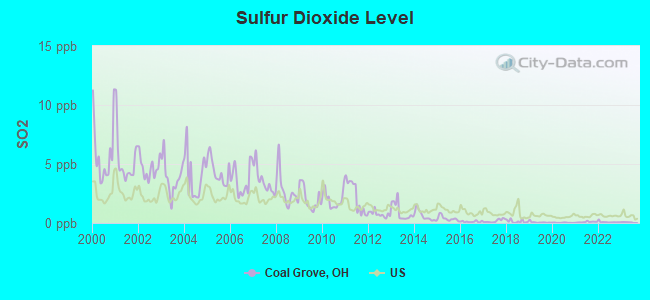
Sulfur Dioxide (SO2) [ppb] level in 2023 was 0.0550. This is significantly better than average.Closest monitor was 0.3 miles away from the city center.
City:
0.0550
U.S.:
1.5147
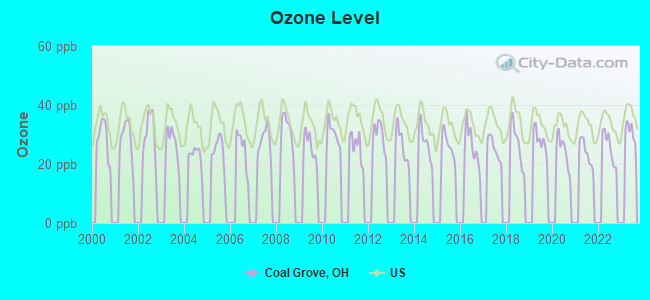
Ozone [ppb] level in 2022 was 25.8. This is better than average.Closest monitor was 0.9 miles away from the city center.
City:
25.8
U.S.:
33.3
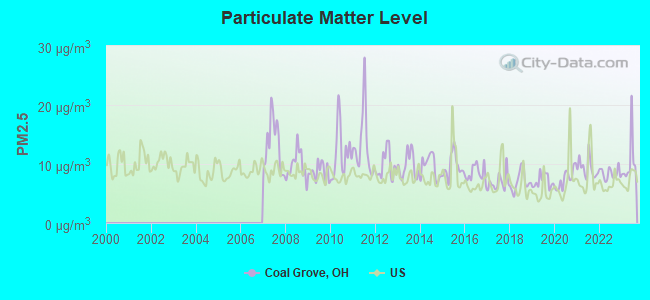
Particulate Matter (PM2.5) [µg/m3] level in 2023 was 10.4. This is worse than average.Closest monitor was 0.9 miles away from the city center.
City:
10.4
U.S.:
8.1
Tornado activity:
Coal Grove-area historical tornado activity is significantly below Ohio state average. It is 50% smaller than the overall U.S. average.
On 4/23/1968, a category F5 (max. wind speeds 261-318 mph) tornado 16.1 miles away from the Coal Grove village center killed 7 peopleand injured 93 peopleand causedbetween $500,000 and $5,000,000 in damages.
On 4/23/1968, a category F4 (max. wind speeds 207-260 mph) tornado 30.1 miles away from the village center killed 6 peopleand injured 364 peopleand causedbetween $5,000,000 and $50,000,000 in damages.
Earthquake activity:
Coal Grove-area historical earthquake activity is significantly above Ohio state average. It is 12% greater than the overall U.S. average.
On 7/27/1980 at 18:52:21, a magnitude 5.2 (5.1 MB, 4.7 MS, 5.0 UK, 5.2 UK, Class: Moderate, Intensity: VI - VII) earthquake occurred 73.3 miles away from Coal Grove center On 8/23/2011 at 17:51:04, a magnitude 5.8 (5.8 MW, Depth: 3.7 mi) earthquake occurred 259.2 miles away from Coal Grove center On 8/9/2020 at 12:07:37, a magnitude 5.1 (5.1 MW, Depth: 4.7 mi) earthquake occurred 163.9 miles away from the city center On 9/7/1988 at 02:28:09, a magnitude 4.6 (4.5 MB, 4.6 LG, Class: Light, Intensity: IV - V) earthquake occurred 71.3 miles away from the city center On 9/25/1998 at 19:52:52, a magnitude 5.2 (4.8 MB, 4.3 MS, 5.2 LG, 4.5 MW, Depth: 3.1 mi) earthquake occurred 238.7 miles away from Coal Grove center On 4/18/2008 at 09:36:59, a magnitude 5.4 (5.1 MB, 4.8 MS, 5.4 MW, 5.2 MW) earthquake occurred 283.7 miles away from Coal Grove center Magnitude types: regional Lg-wave magnitude (LG), body-wave magnitude (MB), surface-wave magnitude (MS), moment magnitude (MW)
Natural disasters:
The number of natural disasters in Lawrence County (14) is near the US average (15). Major Disasters (Presidential) Declared: 9 Emergencies Declared: 2
Causes of natural disasters: Storms: 9, Floods: 8, Landslides: 2, Blizzard: 1, Hurricane: 1, Mudslide: 1, Snowstorm: 1, Tornado: 1, Wind: 1, Winter Storm: 1, Other: 1 (Note: some incidents may be assigned to more than one category).
Hospitals and medical centers in Coal Grove:
ABBOTT HOME CARE, INC (209 MARION PIKE)
SUNSET NURSING CENTER (813 1/2 MARION PIKE)
Other hospitals and medical centers near Coal Grove:
JO-LIN HEALTH CENTER INC (Nursing Home, about 2 miles away; IRONTON, OH)
BRYANT HEALTH CARE CENTER INC (Nursing Home, about 2 miles away; IRONTON, OH)
SANCTUARY OF THE OHIO VALLEY (Nursing Home, about 2 miles away; IRONTON, OH)
FMC - CENTRAL ASHLAND (Dialysis Facility, about 2 miles away; ASHLAND, KY)
AMEDISYS HOME HEALTH (Home Health Center, about 2 miles away; ASHLAND, KY)
FMC - ASHLAND (Dialysis Facility, about 2 miles away; ASHLAND, KY)
COMMUNITY HOSPICE (Hospital, about 2 miles away; ASHLAND, KY)
Amtrak stations near Coal Grove:
2 miles: ASHLAND (99 15TH ST.) . Services: fully wheelchair accessible, enclosed waiting area, public restrooms, public payphones, vending machines, free short-term parking, free long-term parking, call for taxi service, public transit connection.
Lawrence County has a predicted average indoor radon screening level between 2 and 4 pCi/L (pico curies per liter) - Moderate Potential
Drinking water stations with addresses in Coal Grove and their reported violations in the past:
COAL GROVE PWS (Population served: 2,160, Groundwater):
Past monitoring violations:
Monitoring and Reporting (DBP) - Between JUL-2005 and SEP-2005, Contaminant: Total Haloacetic Acids (HAA5). Follow-up actions: St Compliance achieved (OCT-25-2005), St Violation/Reminder Notice (JAN-27-2006), St Public Notif requested (JAN-27-2006), St Public Notif received (APR-28-2006)
Average household size:
This village:
2.5 people
Ohio:
2.4 people
Percentage of family households:
This village:
71.2%
Whole state:
65.0%
Percentage of households with unmarried partners:
This village:
10.0%
Whole state:
6.8%
Likely homosexual households (counted as self-reported same-sex unmarried-partner households)
Lesbian couples: 0.4% of all households
Gay men: 0.1% of all households
39 people in nursing facilities/skilled-nursing facilities in 2010
55 people in nursing homes in 2000
Banks with branches in Coal Grove (2011 data):
PNC Bank, National Association: Coal Grove Branch at 701 South High Street, branch established on 1970/06/15. Info updated 2012/03/20: Bank assets: $263,309.6 mil, Deposits: $197,343.0 mil, headquarters in Wilmington, DE, positive income, Commercial Lending Specialization, 3085 total offices, Holding Company: Pnc Financial Services Group, Inc., The
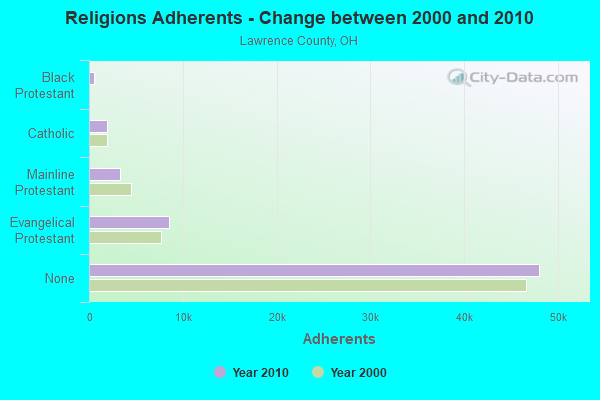
Religion statistics for Coal Grove, OH (based on Lawrence County data)
Religion
Adherents
Congregations
Evangelical Protestant
8,556
58
Mainline Protestant
3,259
23
Catholic
1,928
4
Black Protestant
536
4
Other
125
3
None
48,046
-
Source: Clifford Grammich, Kirk Hadaway, Richard Houseal, Dale E.Jones, Alexei Krindatch, Richie Stanley and Richard H.Taylor. 2012. 2010 U.S.Religion Census: Religious Congregations & Membership Study. Association of Statisticians of American Religious Bodies. Jones, Dale E., et al. 2002. Congregations and Membership in the United States 2000. Nashville, TN: Glenmary Research Center. Graphs represent county-level data
Centenary Hill 2000 Ft S Of Ohio Rt 243 Int (Lat: 38.491750 Lon: -82.639889), Structure height: 8 m, Call Sign: WPDV450, Assigned Frequencies: 173.203 MHz, Grant Date: 10/04/2023, Expiration Date: 11/24/2033, Registrant: Business Radio Licensing, 30251 Golden Lantern Ste E #501, Laguna Niguel, CA 92677-5993, Phone: (949) 348-8510, Fax: (949) 348-8514, Email:
FCC Registered Microwave Towers:
3
KQM69, 8 Mi Ne Of (Lat: 38.479500 Lon: -82.537083), Type: Tower, Structure height: 61 m, Call Sign: WQNH890, Assigned Frequencies: 6685.00 MHz, 6665.00 MHz, Grant Date: 02/09/2011, Expiration Date: 08/08/2011, Cancellation Date: 10/08/2011, Certifier: Richard Gillmore, Registrant: Spectrum And Licensing Services, 11 Lee Street, Hanover, PA 17331, Phone: (717) 630-0816, Fax: (717) 637-8300, Email:
STATION, 8 Mi E Of (Lat: 38.479500 Lon: -82.537083), Overall height: 61 m, Call Sign: KQM69, Assigned Frequencies: 6685.00 MHz, 6665.00 MHz, Grant Date: 08/04/2020, Expiration Date: 10/17/2030, Cancellation Date: 03/23/2022, Certifier: Robert E Smith, Registrant: Spectrum And Licensing Services, 11 Lee Street, Hanover, PA 17331, Phone: (717) 630-0816, Fax: (717) 637-8300, Email:
FCC Registered Amateur Radio Licenses:
4
Call Sign: KB8OIL, Grant Date: 05/18/1993, Expiration Date: 05/18/2003, Cancellation Date: 05/19/2005, Registrant: Jeffery A Young Jr, 119 North St, Coal Grove, OH 45638
Call Sign: KB8PID, Grant Date: 08/31/1993, Expiration Date: 08/31/2003, Cancellation Date: 09/01/2005, Registrant: Cynthia M Caskey, 120 Steece Rd, Coal Grove, OH 45638
Call Sign: KB8PIE, Licensee ID: L00696227, Grant Date: 10/03/2023, Expiration Date: 10/03/2033, Certifier: Carolyn S Hunley, Registrant: Carolyn S Hunley, 705 Lane St, Coal Grove, OH 45638
Call Sign: KB8VHG, Previous Call Sign: KB8PIA, Grant Date: 10/21/1994, Expiration Date: 08/31/2003, Cancellation Date: 09/01/2005, Registrant: Ernest R Caskey, 120 Steece Rd, Coal Grove, OH 45638
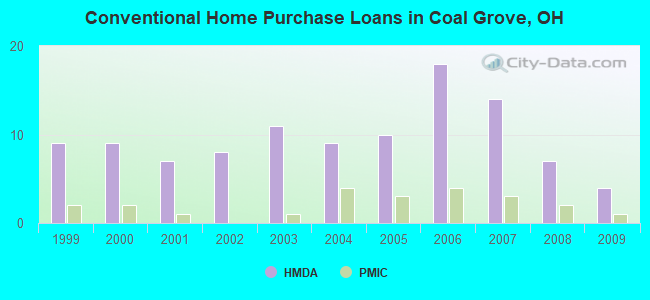
Home Mortgage Disclosure Act Aggregated Statistics For Year 2009 (Based on 1 partial tract)
A) FHA, FSA/RHS & VA Home Purchase Loans
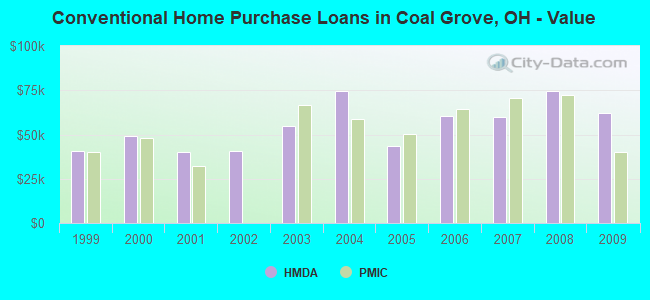
B) Conventional Home Purchase Loans
C) Refinancings
D) Home Improvement Loans
F) Non-occupant Loans on < 5 Family Dwellings (A B C & D)
G) Loans On Manufactured Home Dwelling (A B C & D)
Number
Average Value
Number
Average Value
Number
Average Value
Number
Average Value
Number
Average Value
Number
Average Value
LOANS ORIGINATED
1
$53,100
4
$62,038
11
$58,837
1
$15,650
2
$41,915
1
$54,210
APPLICATIONS APPROVED, NOT ACCEPTED
0
$0
1
$24,030
2
$64,830
0
$0
1
$16,770
0
$0
APPLICATIONS DENIED
1
$110,100
1
$41,920
13
$77,085
6
$23,008
0
$0
1
$53,650
APPLICATIONS WITHDRAWN
0
$0
0
$0
4
$107,310
0
$0
0
$0
0
$0
FILES CLOSED FOR INCOMPLETENESS
0
$0
0
$0
0
$0
1
$36,330
1
$36,330
0
$0
Aggregated Statistics For Year 2008 (Based on 1 partial tract)
A) FHA, FSA/RHS & VA Home Purchase Loans
B) Conventional Home Purchase Loans
C) Refinancings
D) Home Improvement Loans
F) Non-occupant Loans on < 5 Family Dwellings (A B C & D)
G) Loans On Manufactured Home Dwelling (A B C & D)
Number
Average Value
Number
Average Value
Number
Average Value
Number
Average Value
Number
Average Value
Number
Average Value
LOANS ORIGINATED
1
$36,330
7
$74,813
8
$79,504
3
$16,767
3
$65,203
1
$36,330
APPLICATIONS APPROVED, NOT ACCEPTED
0
$0
0
$0
3
$73,217
1
$25,150
0
$0
0
$0
APPLICATIONS DENIED
1
$108,990
2
$35,770
16
$75,347
6
$22,822
2
$68,185
0
$0
APPLICATIONS WITHDRAWN
1
$68,740
0
$0
5
$112,228
0
$0
1
$42,480
1
$40,800
FILES CLOSED FOR INCOMPLETENESS
0
$0
0
$0
2
$71,540
1
$54,770
0
$0
0
$0
Aggregated Statistics For Year 2007 (Based on 1 partial tract)
B) Conventional Home Purchase Loans
C) Refinancings
D) Home Improvement Loans
F) Non-occupant Loans on < 5 Family Dwellings (A B C & D)
G) Loans On Manufactured Home Dwelling (A B C & D)
Number
Average Value
Number
Average Value
Number
Average Value
Number
Average Value
Number
Average Value
LOANS ORIGINATED
14
$59,722
10
$67,627
4
$27,665
6
$32,695
2
$77,965
APPLICATIONS APPROVED, NOT ACCEPTED
1
$8,380
4
$68,885
1
$8,380
1
$8,380
0
$0
APPLICATIONS DENIED
10
$54,381
17
$68,548
5
$40,688
2
$38,845
2
$62,040
APPLICATIONS WITHDRAWN
1
$36,330
5
$62,932
0
$0
0
$0
0
$0
FILES CLOSED FOR INCOMPLETENESS
1
$24,590
1
$130,220
0
$0
0
$0
0
$0
Aggregated Statistics For Year 2006 (Based on 1 partial tract)
A) FHA, FSA/RHS & VA Home Purchase Loans
B) Conventional Home Purchase Loans
C) Refinancings
D) Home Improvement Loans
F) Non-occupant Loans on < 5 Family Dwellings (A B C & D)
G) Loans On Manufactured Home Dwelling (A B C & D)
Number
Average Value
Number
Average Value
Number
Average Value
Number
Average Value
Number
Average Value
Number
Average Value
LOANS ORIGINATED
1
$91,100
18
$60,486
15
$45,420
4
$18,442
3
$21,423
2
$37,725
APPLICATIONS APPROVED, NOT ACCEPTED
0
$0
7
$34,731
5
$69,528
2
$17,045
0
$0
1
$16,210
APPLICATIONS DENIED
0
$0
5
$42,142
13
$80,611
8
$26,758
1
$49,740
3
$42,103
APPLICATIONS WITHDRAWN
1
$39,120
1
$61,480
7
$59,163
1
$69,860
1
$30,740
0
$0
FILES CLOSED FOR INCOMPLETENESS
0
$0
1
$82,720
3
$129,107
0
$0
0
$0
0
$0
Aggregated Statistics For Year 2005 (Based on 1 partial tract)
A) FHA, FSA/RHS & VA Home Purchase Loans
B) Conventional Home Purchase Loans
C) Refinancings
D) Home Improvement Loans
E) Loans on Dwellings For 5+ Families
F) Non-occupant Loans on < 5 Family Dwellings (A B C & D)
G) Loans On Manufactured Home Dwelling (A B C & D)
Number
Average Value
Number
Average Value
Number
Average Value
Number
Average Value
Number
Average Value
Number
Average Value
Number
Average Value
LOANS ORIGINATED
3
$97,620
10
$43,371
11
$78,653
6
$31,857
0
$0
5
$45,160
1
$84,950
APPLICATIONS APPROVED, NOT ACCEPTED
0
$0
2
$31,300
3
$51,047
1
$63,160
1
$76,010
0
$0
1
$34,650
APPLICATIONS DENIED
1
$61,480
13
$45,443
15
$63,528
3
$75,267
0
$0
2
$29,900
6
$35,303
APPLICATIONS WITHDRAWN
0
$0
1
$19,560
10
$65,894
2
$61,480
0
$0
0
$0
1
$63,710
FILES CLOSED FOR INCOMPLETENESS
0
$0
2
$49,740
1
$159,850
0
$0
0
$0
1
$30,180
0
$0
Aggregated Statistics For Year 2004 (Based on 1 partial tract)
A) FHA, FSA/RHS & VA Home Purchase Loans
B) Conventional Home Purchase Loans
C) Refinancings
D) Home Improvement Loans
E) Loans on Dwellings For 5+ Families
F) Non-occupant Loans on < 5 Family Dwellings (A B C & D)
G) Loans On Manufactured Home Dwelling (A B C & D)
Number
Average Value
Number
Average Value
Number
Average Value
Number
Average Value
Number
Average Value
Number
Average Value
Number
Average Value
LOANS ORIGINATED
1
$66,510
9
$74,707
24
$57,147
6
$26,268
0
$0
4
$32,975
1
$50,300
APPLICATIONS APPROVED, NOT ACCEPTED
0
$0
1
$61,480
5
$94,230
1
$15,650
0
$0
1
$41,920
0
$0
APPLICATIONS DENIED
1
$30,180
10
$40,073
22
$70,498
3
$16,207
1
$145,310
1
$13,970
6
$32,975
APPLICATIONS WITHDRAWN
0
$0
1
$44,150
13
$70,895
0
$0
0
$0
1
$20,120
0
$0
FILES CLOSED FOR INCOMPLETENESS
0
$0
0
$0
3
$53,840
0
$0
0
$0
1
$17,330
0
$0
Aggregated Statistics For Year 2003 (Based on 1 partial tract)
A) FHA, FSA/RHS & VA Home Purchase Loans
B) Conventional Home Purchase Loans
C) Refinancings
D) Home Improvement Loans
F) Non-occupant Loans on < 5 Family Dwellings (A B C & D)
Number
Average Value
Number
Average Value
Number
Average Value
Number
Average Value
Number
Average Value
LOANS ORIGINATED
2
$65,390
11
$54,722
31
$67,609
6
$20,587
4
$42,755
APPLICATIONS APPROVED, NOT ACCEPTED
0
$0
0
$0
7
$74,413
1
$7,820
1
$18,440
APPLICATIONS DENIED
1
$58,130
7
$45,830
20
$67,152
2
$58,125
1
$32,980
APPLICATIONS WITHDRAWN
1
$26,830
1
$46,950
7
$70,980
1
$83,280
0
$0
FILES CLOSED FOR INCOMPLETENESS
1
$40,240
0
$0
3
$66,137
0
$0
1
$27,390
Aggregated Statistics For Year 2002 (Based on 1 partial tract)
A) FHA, FSA/RHS & VA Home Purchase Loans
B) Conventional Home Purchase Loans
C) Refinancings
D) Home Improvement Loans
F) Non-occupant Loans on < 5 Family Dwellings (A B C & D)
Number
Average Value
Number
Average Value
Number
Average Value
Number
Average Value
Number
Average Value
LOANS ORIGINATED
2
$55,330
8
$40,800
20
$65,726
4
$18,025
6
$24,312
APPLICATIONS APPROVED, NOT ACCEPTED
1
$15,090
2
$32,975
7
$71,220
1
$7,820
0
$0
APPLICATIONS DENIED
1
$34,650
6
$51,792
22
$66,306
2
$6,705
1
$42,480
APPLICATIONS WITHDRAWN
1
$15,650
1
$69,300
5
$66,732
0
$0
1
$54,210
FILES CLOSED FOR INCOMPLETENESS
0
$0
1
$37,450
3
$90,913
0
$0
2
$66,790
Aggregated Statistics For Year 2001 (Based on 1 partial tract)
A) FHA, FSA/RHS & VA Home Purchase Loans
B) Conventional Home Purchase Loans
C) Refinancings
D) Home Improvement Loans
F) Non-occupant Loans on < 5 Family Dwellings (A B C & D)
Number
Average Value
Number
Average Value
Number
Average Value
Number
Average Value
Number
Average Value
LOANS ORIGINATED
2
$84,115
7
$39,841
23
$65,075
7
$18,523
3
$39,310
APPLICATIONS APPROVED, NOT ACCEPTED
1
$48,620
4
$38,425
6
$44,433
0
$0
1
$24,030
APPLICATIONS DENIED
0
$0
13
$44,282
17
$53,720
6
$8,663
2
$28,505
APPLICATIONS WITHDRAWN
0
$0
2
$32,415
8
$47,158
0
$0
1
$8,940
FILES CLOSED FOR INCOMPLETENESS
1
$11,740
0
$0
2
$42,195
1
$1,120
0
$0
Aggregated Statistics For Year 2000 (Based on 1 partial tract)
A) FHA, FSA/RHS & VA Home Purchase Loans
B) Conventional Home Purchase Loans
C) Refinancings
D) Home Improvement Loans
F) Non-occupant Loans on < 5 Family Dwellings (A B C & D)
Number
Average Value
Number
Average Value
Number
Average Value
Number
Average Value
Number
Average Value
LOANS ORIGINATED
1
$22,360
9
$48,997
15
$56,151
6
$8,570
2
$24,310
APPLICATIONS APPROVED, NOT ACCEPTED
1
$41,360
2
$34,370
5
$45,606
2
$7,265
0
$0
APPLICATIONS DENIED
2
$38,005
14
$38,045
15
$41,135
3
$19,933
1
$17,880
APPLICATIONS WITHDRAWN
0
$0
4
$46,948
6
$34,093
0
$0
1
$11,180
FILES CLOSED FOR INCOMPLETENESS
0
$0
0
$0
1
$39,120
0
$0
0
$0
Aggregated Statistics For Year 1999 (Based on 1 partial tract)
A) FHA, FSA/RHS & VA Home Purchase Loans
B) Conventional Home Purchase Loans
C) Refinancings
D) Home Improvement Loans
F) Non-occupant Loans on < 5 Family Dwellings (A B C & D)
Detailed PMIC statistics for the following Tracts:0509.00
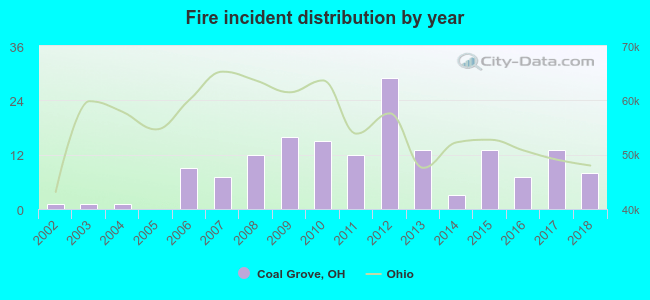
2002 - 2018 National Fire Incident Reporting System (NFIRS) incidents
Based on the data from the years 2002 - 2018 the average number of fire incidents per year is 9. The highest number of reported fire incidents - 29 took place in 2012, and the least - 0 in 2005. The data has an increasing trend.
When looking into fire subcategories, the most reports belonged to: Structure Fires (50.6%), and Outside Fires (25.0%).
Fire incident types reported to NFIRS in Coal Grove, OH


 Recent articles from our blog. Our writers, many of them Ph.D. graduates or candidates, create easy-to-read articles on a wide variety of topics.
 (13.0 miles


 Based on the data from the years 2002 - 2018 the average number of fire incidents per year is 9. The highest number of reported fire incidents - 29 took place in 2012, and the least - 0 in 2005. The data has an increasing trend.
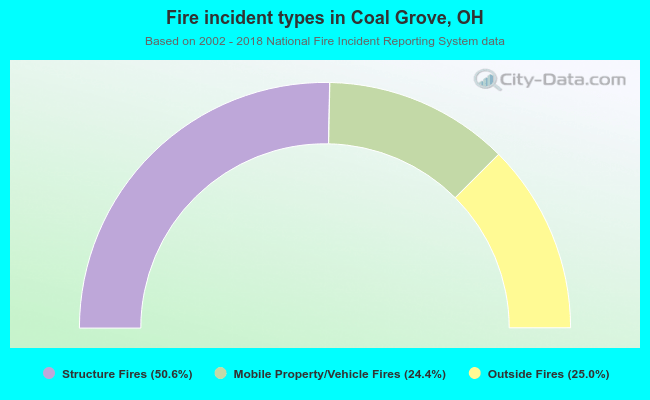 When looking into fire subcategories, the most reports belonged to: Structure Fires (50.6%), and Outside Fires (25.0%).