Leacock-Leola-Bareville, Pennsylvania
Submit your own pictures of this place and show them to the world
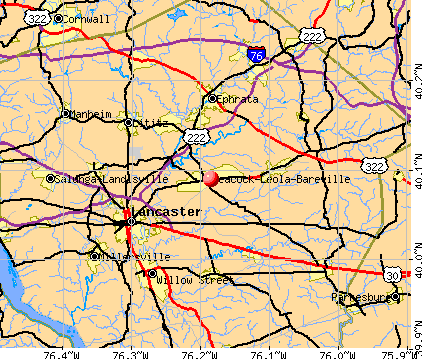
- OSM Map
- General Map
- Google Map
- MSN Map
Population change since 2000: +8.9%
| Males: 3,537 | |
| Females: 3,677 |
| Median resident age: | 37.8 years |
| Pennsylvania median age: | 40.1 years |
Zip codes: 17540.
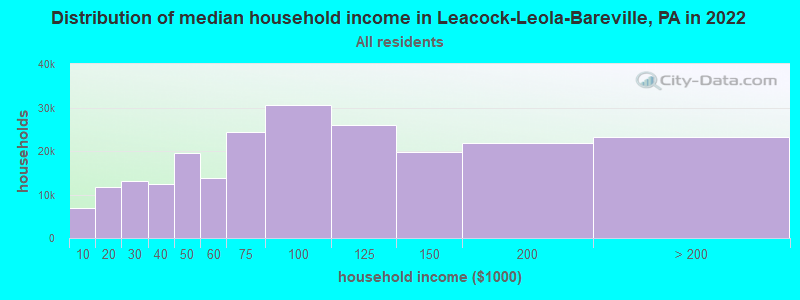
| Leacock-Leola-Bareville: | $86,983 |
| PA: | $71,798 |
Estimated per capita income in 2022: $45,068 (it was $22,369 in 2000)
Leacock-Leola-Bareville CDP income, earnings, and wages data
Estimated median house or condo value in 2022: $320,703 (it was $132,100 in 2000)
| Leacock-Leola-Bareville: | $320,703 |
| PA: | $245,500 |
Mean prices in 2022: all housing units: $324,282; detached houses: $348,032; townhouses or other attached units: $268,597; in 2-unit structures: $262,787; in 3-to-4-unit structures: $620,213; in 5-or-more-unit structures: $217,555; mobile homes: $208,947
Leacock-Leola-Bareville, PA residents, houses, and apartments details
Detailed information about poverty and poor residents in Leacock-Leola-Bareville, PA


- 6,15985.4%White alone
- 5397.5%Hispanic
- 3394.7%Asian alone
- 841.2%Black alone
- 771.1%Two or more races
- 70.10%Other race alone
- 50.07%American Indian alone
- 40.06%Native Hawaiian and Other
Pacific Islander alone
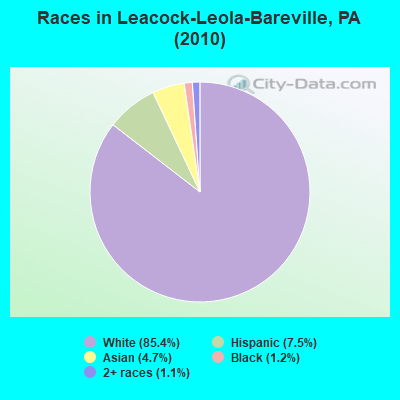
Races in Leacock-Leola-Bareville detailed stats: ancestries, foreign born residents, place of birth
 Recent articles from our blog. Our writers, many of them Ph.D. graduates or candidates, create easy-to-read articles on a wide variety of topics.


Ancestries: German (35.0%), Irish (10.5%), United States (8.4%), Italian (7.3%), English (3.9%), Swiss (3.2%).
Current Local Time: EST time zone
Land area: 6.03 square miles.
Population density: 1,196 people per square mile (low).
494 residents are foreign born (4.3% Asia, 1.6% Latin America, 1.1% Europe).
| This place: | 7.5% |
| Pennsylvania: | 4.1% |
| Leacock-Leola-Bareville CDP: | 1.3% ($1,764) |
| Pennsylvania: | 1.6% ($1,552) |
Nearest city with pop. 50,000+: Lancaster, PA  (7.2 miles , pop. 56,348).
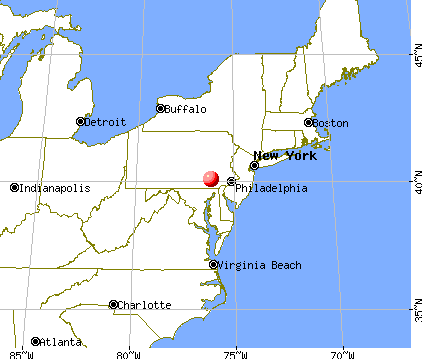
Nearest city with pop. 200,000+: Philadelphia, PA (55.4 miles , pop. 1,517,550).
Nearest cities:
), ), ), ), ), )Latitude: 40.09 N, Longitude: 76.18 W
Daytime population change due to commuting: +1,500 (+22.6%)
Workers who live and work in this place: 803 (24.4%)
Area code commonly used in this area: 717
| Here: | 2.3% |
| Pennsylvania: | 2.9% |
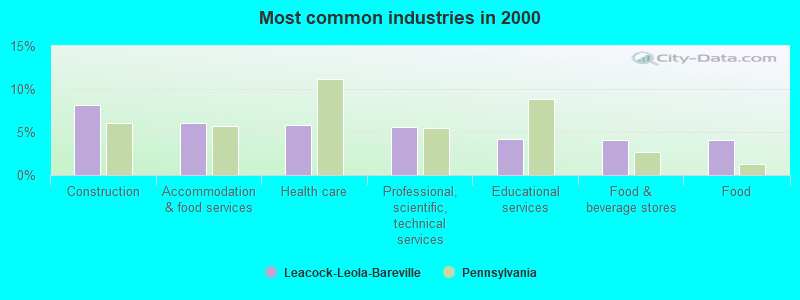
- Construction (8.1%)
- Accommodation & food services (6.0%)
- Health care (5.8%)
- Professional, scientific, technical services (5.6%)
- Educational services (4.2%)
- Food & beverage stores (4.1%)
- Food (4.0%)
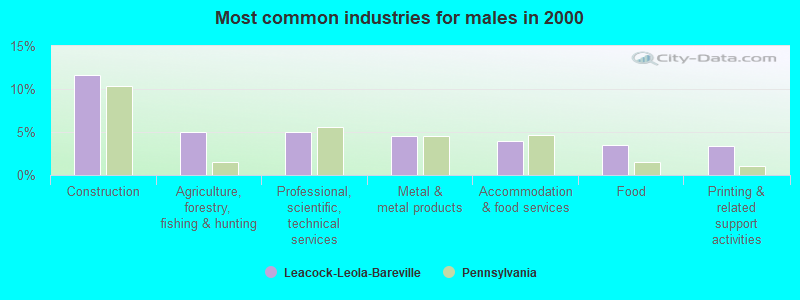
- Construction (11.6%)
- Agriculture, forestry, fishing & hunting (5.0%)
- Professional, scientific, technical services (5.0%)
- Metal & metal products (4.6%)
- Accommodation & food services (4.0%)
- Food (3.5%)
- Printing & related support activities (3.4%)
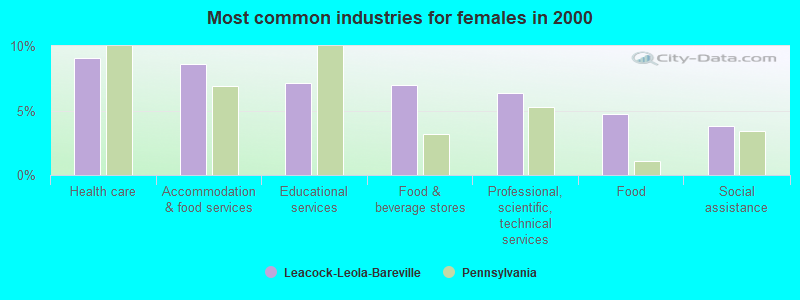
- Health care (9.1%)
- Accommodation & food services (8.6%)
- Educational services (7.1%)
- Food & beverage stores (7.0%)
- Professional, scientific, technical services (6.4%)
- Food (4.7%)
- Social assistance (3.8%)
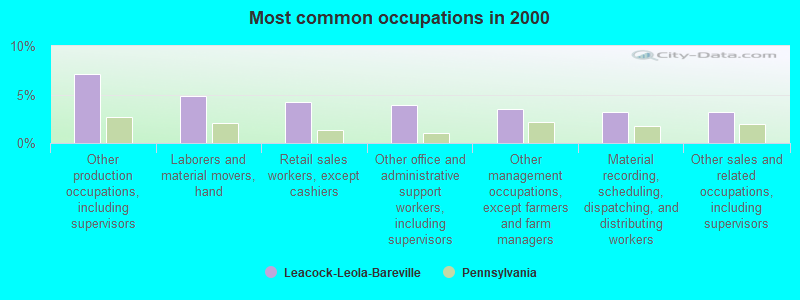
- Other production occupations, including supervisors (7.1%)
- Laborers and material movers, hand (4.8%)
- Retail sales workers, except cashiers (4.2%)
- Other office and administrative support workers, including supervisors (3.9%)
- Other management occupations, except farmers and farm managers (3.5%)
- Material recording, scheduling, dispatching, and distributing workers (3.2%)
- Other sales and related occupations, including supervisors (3.2%)
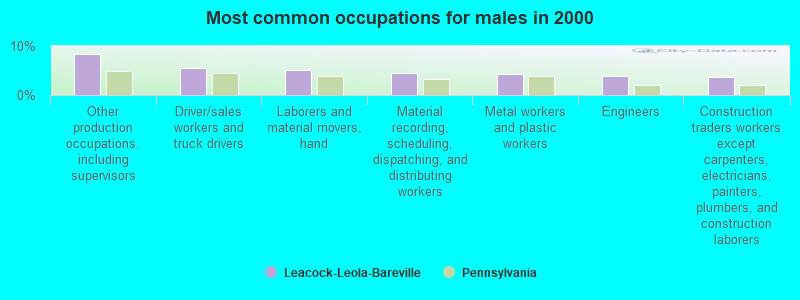
- Other production occupations, including supervisors (8.5%)
- Driver/sales workers and truck drivers (5.5%)
- Laborers and material movers, hand (5.0%)
- Material recording, scheduling, dispatching, and distributing workers (4.5%)
- Metal workers and plastic workers (4.2%)
- Engineers (3.9%)
- Construction traders workers except carpenters, electricians, painters, plumbers, and construction laborers (3.7%)
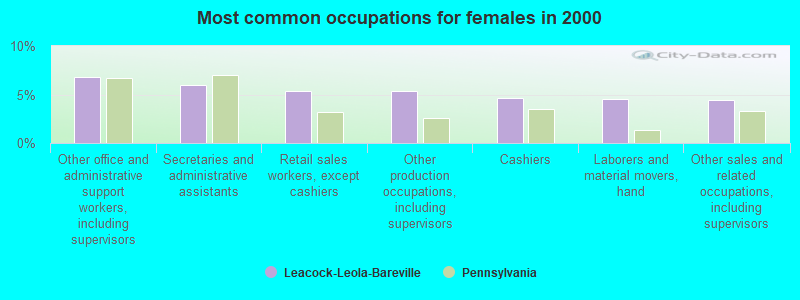
- Other office and administrative support workers, including supervisors (6.8%)
- Secretaries and administrative assistants (6.0%)
- Retail sales workers, except cashiers (5.4%)
- Other production occupations, including supervisors (5.3%)
- Cashiers (4.6%)
- Laborers and material movers, hand (4.5%)
- Other sales and related occupations, including supervisors (4.4%)
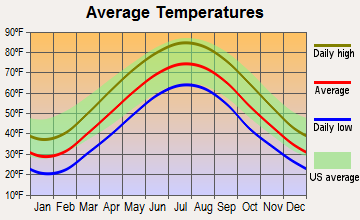
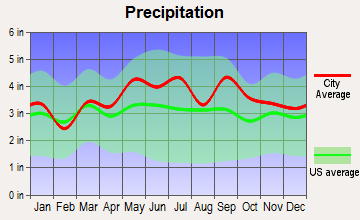
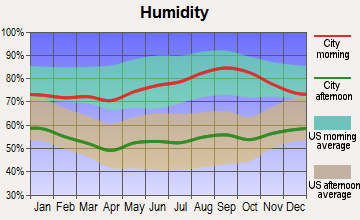
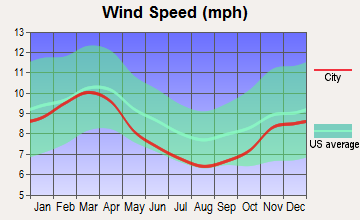
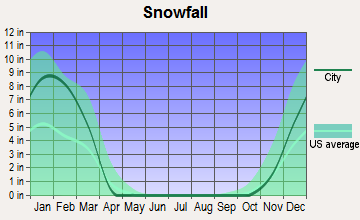
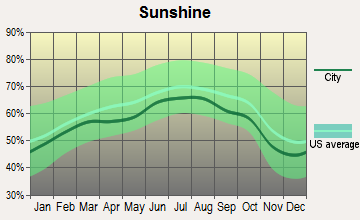
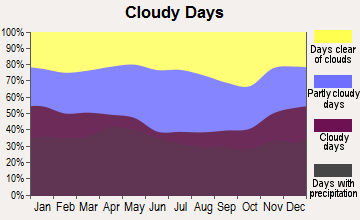
Average climate in Leacock-Leola-Bareville, Pennsylvania
Based on data reported by over 4,000 weather stations
(lower is better)
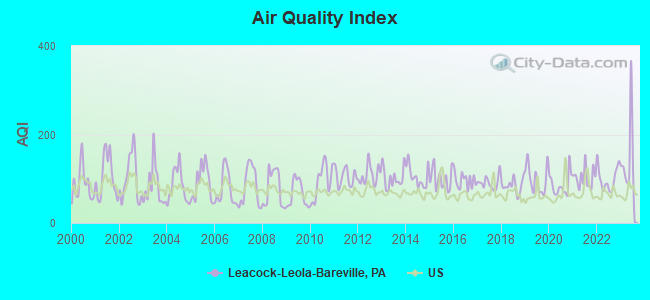
Air Quality Index (AQI) level in 2023 was 130. This is significantly worse than average.
| City: | 130 |
| U.S.: | 73 |
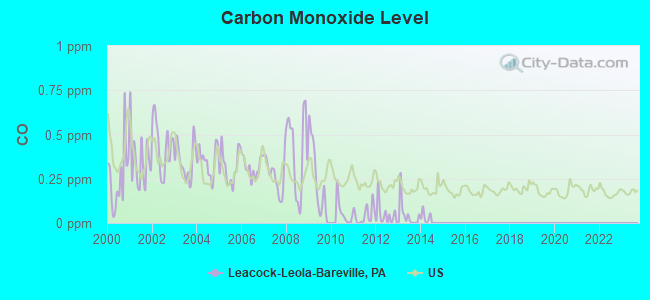
Carbon Monoxide (CO) [ppm] level in 2013 was 0.0450. This is significantly better than average. Closest monitor was 6.0 miles away from the city center.
| City: | 0.0450 |
| U.S.: | 0.2513 |
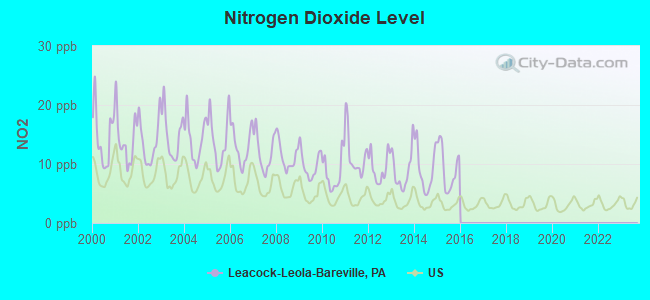
Nitrogen Dioxide (NO2) [ppb] level in 2015 was 9.24. This is significantly worse than average. Closest monitor was 6.0 miles away from the city center.
| City: | 9.24 |
| U.S.: | 5.11 |
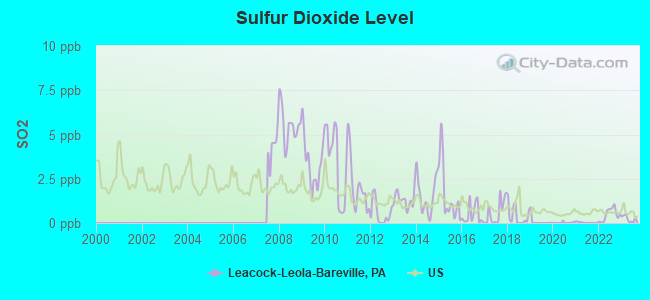
Sulfur Dioxide (SO2) [ppb] level in 2023 was 0.247. This is significantly better than average. Closest monitor was 6.7 miles away from the city center.
| City: | 0.247 |
| U.S.: | 1.515 |
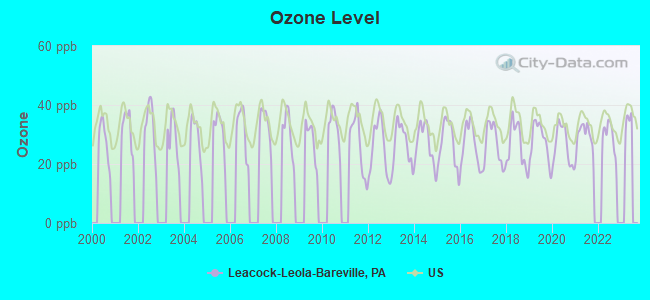
Ozone [ppb] level in 2022 was 29.5. This is about average. Closest monitor was 6.0 miles away from the city center.
| City: | 29.5 |
| U.S.: | 33.3 |
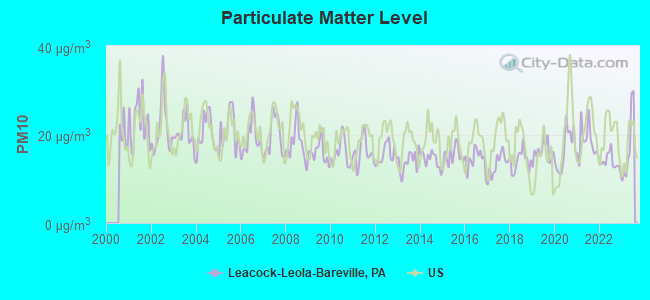
Particulate Matter (PM10) [µg/m3] level in 2023 was 17.3. This is about average. Closest monitor was 6.0 miles away from the city center.
| City: | 17.3 |
| U.S.: | 19.2 |
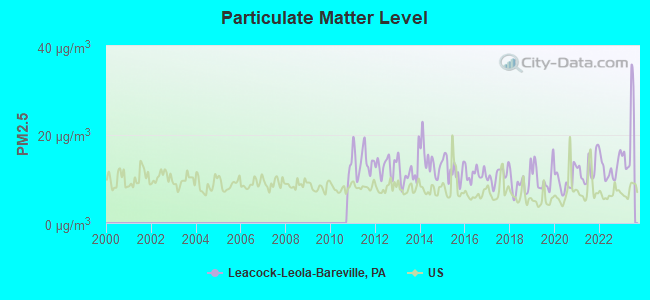
Particulate Matter (PM2.5) [µg/m3] level in 2023 was 19.4. This is significantly worse than average. Closest monitor was 5.0 miles away from the city center.
| City: | 19.4 |
| U.S.: | 8.1 |
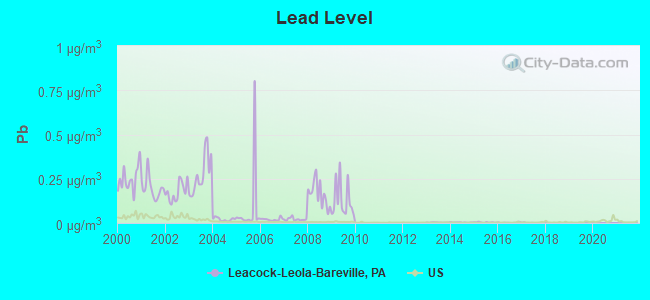
Lead (Pb) [µg/m3] level in 2016 was 0.00204. This is significantly better than average. Closest monitor was 5.9 miles away from the city center.
| City: | 0.00204 |
| U.S.: | 0.00931 |
Tornado activity:
Leacock-Leola-Bareville-area historical tornado activity is above Pennsylvania state average. It is 21% greater than the overall U.S. average.
On 11/4/1950, a category F3 (max. wind speeds 158-206 mph) tornado 8.4 miles away from the Leacock-Leola-Bareville place center injured one person and caused between $50,000 and $500,000 in damages.
On 6/18/1970, a category F3 tornado 21.6 miles away from the place center killed one person and injured 5 people and caused between $500,000 and $5,000,000 in damages.
Earthquake activity:
Leacock-Leola-Bareville-area historical earthquake activity is significantly above Pennsylvania state average. It is 62% smaller than the overall U.S. average.On 8/23/2011 at 17:51:04, a magnitude 5.8 (5.8 MW, Depth: 3.7 mi, Class: Moderate, Intensity: VI - VII) earthquake occurred 177.7 miles away from the city center
On 1/16/1994 at 01:49:16, a magnitude 4.6 (4.6 MB, 4.6 LG, Depth: 3.1 mi, Class: Light, Intensity: IV - V) earthquake occurred 18.4 miles away from the city center
On 1/16/1994 at 00:42:43, a magnitude 4.2 (4.2 MB, 4.0 LG, Depth: 3.1 mi) earthquake occurred 18.9 miles away from Leacock-Leola-Bareville center
On 9/25/1998 at 19:52:52, a magnitude 5.2 (4.8 MB, 4.3 MS, 5.2 LG, 4.5 MW, Depth: 3.1 mi) earthquake occurred 240.9 miles away from Leacock-Leola-Bareville center
On 10/7/1983 at 10:18:46, a magnitude 5.3 (5.1 MB, 5.3 LG, 5.1 ML) earthquake occurred 283.5 miles away from Leacock-Leola-Bareville center
On 11/30/2017 at 21:47:31, a magnitude 4.1 (4.1 MW, Depth: 6.1 mi) earthquake occurred 73.6 miles away from the city center
Magnitude types: regional Lg-wave magnitude (LG), body-wave magnitude (MB), local magnitude (ML), surface-wave magnitude (MS), moment magnitude (MW)
Natural disasters:
The number of natural disasters in Lancaster County (19) is greater than the US average (15).Major Disasters (Presidential) Declared: 14
Emergencies Declared: 5
Causes of natural disasters: Floods: 5, Storms: 5, Winter Storms: 5, Hurricanes: 3, Snowstorms: 3, Tropical Storms: 3, Blizzard: 1, Heavy Rain: 1, Mudslide: 1, Snowfall: 1, Other: 1 (Note: some incidents may be assigned to more than one category).

Hospitals and medical centers near Leacock-Leola-Bareville:
- BAYADA NURSES INC (Home Health Center, about 5 miles away; LANCASTER, PA)
- EXTENDED FAMILY CARE (Home Health Center, about 5 miles away; LANCASTER, PA)
- MAPLE FARM (Nursing Home, about 5 miles away; AKRON, PA)
- LANDIS HOMES (Nursing Home, about 5 miles away; LITITZ, PA)
- EPHRATA MANOR (Nursing Home, about 6 miles away; EPHRATA, PA)
- FRIENDSHIP COMMUNITY (Hospital, about 6 miles away; LANCASTER, PA)
- GARDEN SPOT VILLAGE (Nursing Home, about 6 miles away; NEW HOLLAND, PA)
Amtrak stations near Leacock-Leola-Bareville:
- 7 miles: LANCASTER (53 MCGOVERN AVE.) . Services: ticket office, partially wheelchair accessible, enclosed waiting area, public restrooms, public payphones, vending machines, ATM, paid short-term parking, paid long-term parking, call for car rental service, call for taxi service, intercity bus service, public transit connection.
- 17 miles: PARKESBURG (WEST 1ST & S. CULVERT STS.) . Services: public payphones, free short-term parking.
- 17 miles: MOUNT JOY (DELTA & HENRY STS.) . Services: public payphones, free short-term parking, call for taxi service, public transit connection.
Colleges/universities with over 2000 students nearest to Leacock-Leola-Bareville:
- Franklin and Marshall College (about 8 miles; Lancaster, PA; Full-time enrollment: 2,585)
- Millersville University of Pennsylvania (about 12 miles; Millersville, PA; FT enrollment: 7,743)
- Alvernia University (about 21 miles; Reading, PA; FT enrollment: 2,461)
- Reading Area Community College (about 22 miles; Reading, PA; FT enrollment: 2,941)
- Pennsylvania State University-Penn State Berks (about 22 miles; Reading, PA; FT enrollment: 2,605)
- Albright College (about 24 miles; Reading, PA; FT enrollment: 2,319)
- Lincoln University of Pennsylvania (about 24 miles; Lincoln University, PA; FT enrollment: 2,042)
Points of interest:
Notable locations in Leacock-Leola-Bareville: Upper Leacock Fire Company Station 3 - 11 (A), Bareville Fire Company (B). Display/hide their locations on the map
Park in Leacock-Leola-Bareville: Leola Community Park (1). Display/hide its location on the map
| This place: | 2.8 people |
| Pennsylvania: | 2.5 people |
| This place: | 74.1% |
| Whole state: | 65.0% |
| This place: | 6.0% |
| Whole state: | 6.6% |
Likely homosexual households (counted as self-reported same-sex unmarried-partner households)
- Lesbian couples: 0.3% of all households
- Gay men: 0.2% of all households
| This place: | 4.7% |
| Whole state: | 11.0% |
| This place: | 2.5% |
| Whole state: | 5.1% |
13 people in homes for the mentally retarded in 2000
For population 15 years and over in Leacock-Leola-Bareville:
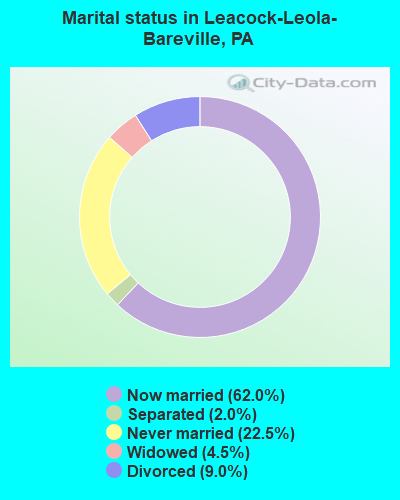
- Never married: 22.5%
- Now married: 62.0%
- Separated: 2.0%
- Widowed: 4.5%
- Divorced: 9.0%
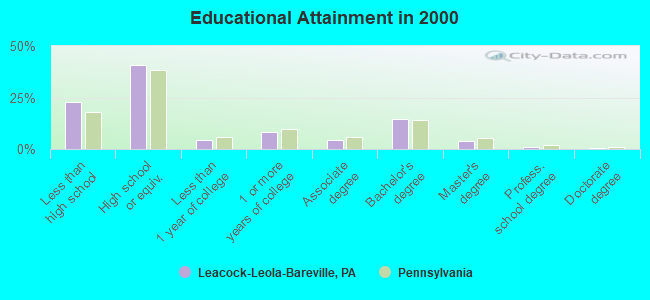
For population 25 years and over in Leacock-Leola-Bareville:
- High school or higher: 77.1%
- Bachelor's degree or higher: 19.5%
- Graduate or professional degree: 5.1%
- Unemployed: 2.8%
- Mean travel time to work (commute): 18.9 minutes
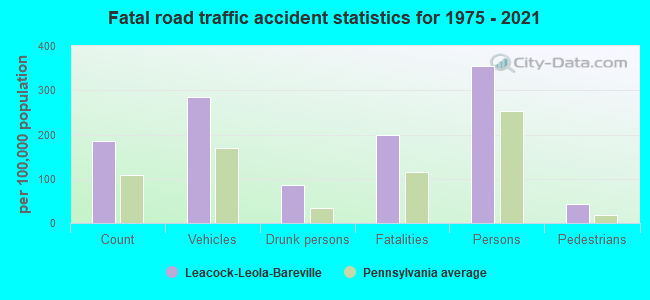
| Here: | 12.4 |
| Pennsylvania average: | 11.8 |
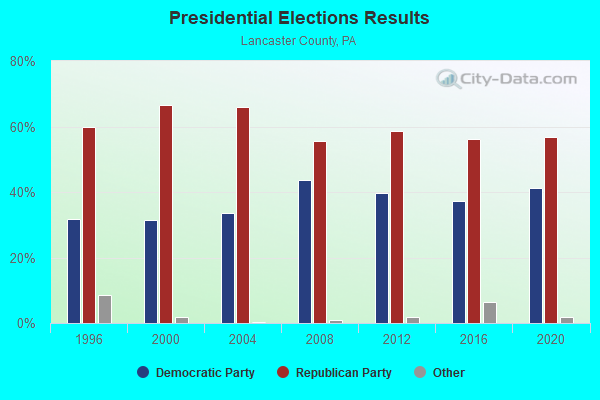
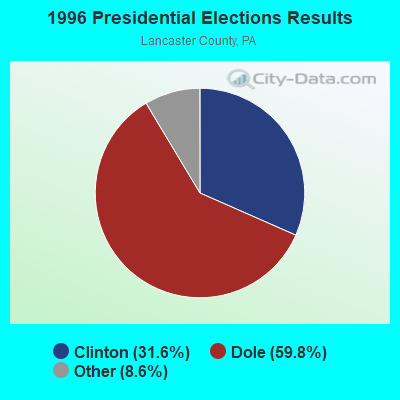
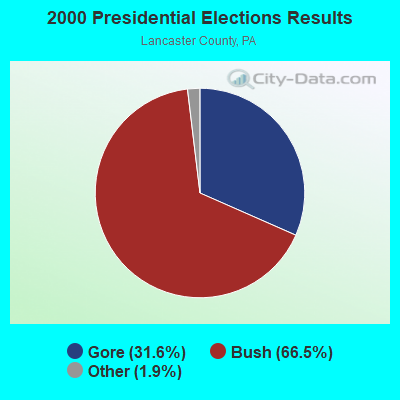

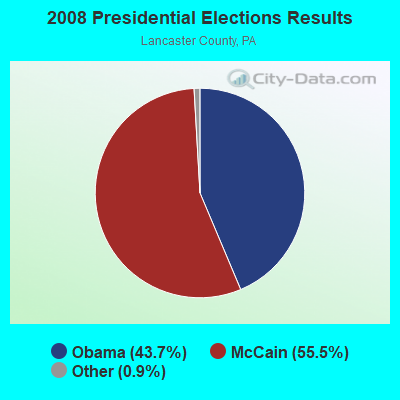
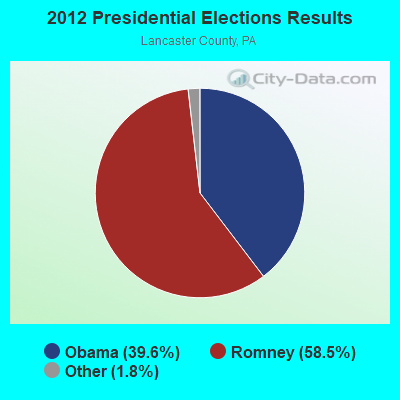

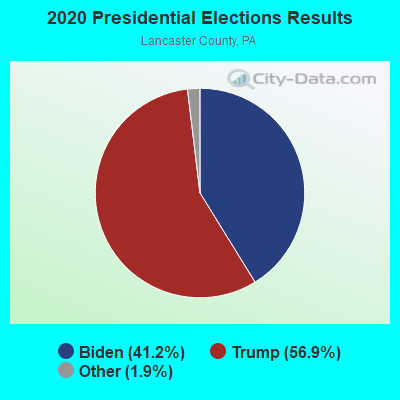
Graphs represent county-level data. Detailed 2008 Election Results
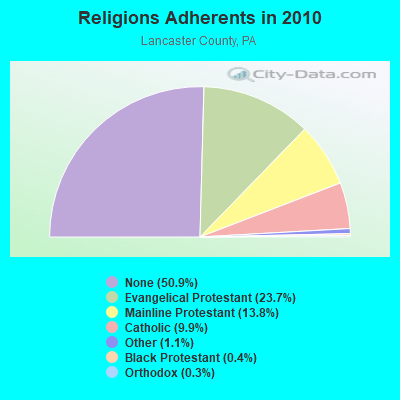
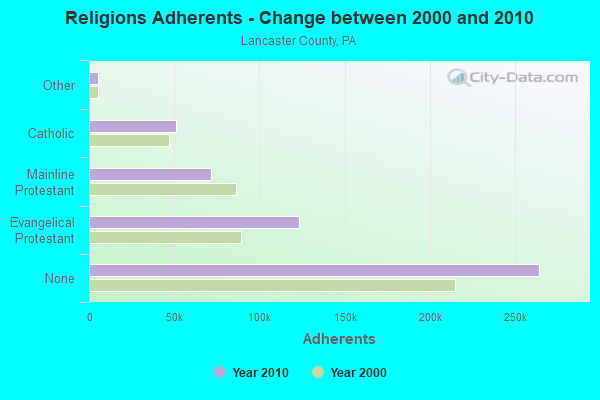
Religion statistics for Leacock-Leola-Bareville, PA (based on Lancaster County data)
| Religion | Adherents | Congregations |
|---|---|---|
| Evangelical Protestant | 122,957 | 568 |
| Mainline Protestant | 71,573 | 192 |
| Catholic | 51,292 | 20 |
| Other | 5,536 | 20 |
| Black Protestant | 2,163 | 8 |
| Orthodox | 1,600 | 2 |
| None | 264,324 | - |
Food Environment Statistics:
| Lancaster County: | 2.13 / 10,000 pop. |
| Pennsylvania: | 2.04 / 10,000 pop. |
| Lancaster County: | 0.08 / 10,000 pop. |
| State: | 0.09 / 10,000 pop. |
| Here: | 0.62 / 10,000 pop. |
| State: | 0.88 / 10,000 pop. |
| This county: | 2.63 / 10,000 pop. |
| State: | 2.52 / 10,000 pop. |
| This county: | 5.94 / 10,000 pop. |
| State: | 7.12 / 10,000 pop. |
| Lancaster County: | 8.4% |
| State: | 9.1% |
| Lancaster County: | 27.4% |
| Pennsylvania: | 27.2% |
| Lancaster County: | 13.1% |
| Pennsylvania: | 11.5% |
4.04% of this county's 2021 resident taxpayers lived in other counties in 2020 ($63,382 average adjusted gross income)
| Here: | 4.04% |
| Pennsylvania average: | 5.27% |
0.01% of residents moved from foreign countries ($104 average AGI)
Lancaster County: 0.01% Pennsylvania average: 0.01%
Top counties from which taxpayers relocated into this county between 2020 and 2021:
| from York County, PA | |
| from Berks County, PA | |
| from Chester County, PA |
4.16% of this county's 2020 resident taxpayers moved to other counties in 2021 ($63,657 average adjusted gross income)
| Here: | 4.16% |
| Pennsylvania average: | 5.44% |
0.01% of residents moved to foreign countries ($74 average AGI)
Lancaster County: 0.01% Pennsylvania average: 0.01%
Top counties to which taxpayers relocated from this county between 2020 and 2021:
| to York County, PA | |
| to Dauphin County, PA | |
| to Chester County, PA |
Strongest AM radio stations in Leacock-Leola-Bareville:
- WEEU (830 AM; 20 kW; READING, PA; Owner: WEEU BROADCASTING COMPANY)
- WLAN (1390 AM; 5 kW; LANCASTER, PA)
- WVCH (740 AM; 50 kW; CHESTER, PA; Owner: WVCH COMMUNICATIONS, INC.)
- WWJZ (640 AM; 50 kW; MOUNT HOLLY, NJ; Owner: ABC, INC.)
- WZZD (990 AM; 50 kW; PHILADELPHIA, PA; Owner: PENNSYLVANIA MEDIA ASSOCIATES, INC.)
- WPEN (950 AM; 50 kW; PHILADELPHIA, PA; Owner: GREATER PHILADELPHIA RADIO, INC.)
- KYW (1060 AM; 50 kW; PHILADELPHIA, PA; Owner: INFINITY BROADCASTING OPERATIONS, INC.)
- WCBM (680 AM; 50 kW; BALTIMORE, MD; Owner: WCBM MARYLAND, INC.)
- WBAL (1090 AM; 50 kW; BALTIMORE, MD; Owner: HEARST RADIO, INC.)
- WNWR (1540 AM; 50 kW; PHILADELPHIA, PA)
- WWLG (1370 AM; 50 kW; BALTIMORE, MD; Owner: M-10 BROADCASTING, INC.)
- WPHT (1210 AM; 50 kW; PHILADELPHIA, PA; Owner: INFINITY BROADCASTING OPERATIONS, INC.)
- WGOP (700 AM; daytime; 25 kW; WALKERSVILLE, MD; Owner: BIRACH BROADCASTING CORPORATION)
Strongest FM radio stations in Leacock-Leola-Bareville:
- WIOV-FM (105.1 FM; EPHRATA, PA; Owner: REGENT BROADCASTING OF LANCASTER, INC.)
- WJTL (90.3 FM; LANCASTER, PA; Owner: CREATIVE MINISTRIES, INC.)
- WDAC (94.5 FM; LANCASTER, PA; Owner: WDAC RADIO COMPANY)
- WRTL (90.7 FM; EPHRATA, PA; Owner: TEMPLE UNIV OF COMMONWEALTH SYSTEM)
- WARM-FM (103.3 FM; YORK, PA; Owner: WSBA LICO, INC.)
- WROZ (101.3 FM; LANCASTER, PA; Owner: HALL COMMUNICATIONS, INC.)
- WCAT-FM (106.7 FM; HERSHEY, PA; Owner: CITADEL BROADCASTING COMPANY)
- WBMP (88.1 FM; WARWICK, PA; Owner: FOUR RIVERS COMMUNITY BROADCASTING CORP.)
- WIOV-FM1 (105.1 FM; READING, PA; Owner: REGENT BROADCASTING OF LANCASTER, INC.)
- WLAN-FM (96.9 FM; LANCASTER, PA; Owner: CLEAR CHANNEL BROADCASTING LICENSES, INC.)
- W259AA (99.7 FM; LANCASTER, PA; Owner: WITF, INC.)
- WLCH (91.3 FM; LANCASTER, PA; Owner: SPANISH AMERICAN CIVIC ASSC FOR EQUL)
- WSOX (96.1 FM; RED LION, PA; Owner: LANCASTER-YORK BROADCASTING, LLC)
- WRFY-FM (102.5 FM; READING, PA; Owner: CLEAR CHANNEL BROADCASTING LICENSES, INC.)
- WITF-FM (89.5 FM; HARRISBURG, PA; Owner: WITF, INC.)
- WFNM (89.1 FM; LANCASTER, PA; Owner: FRANKLIN AND MARSHALL COLLEGE)
- W220BX (91.9 FM; MARIETTA, PA; Owner: CALVARY CHAPEL OF TWIN FALLS, INC.)
- WHBO (92.7 FM; STARVIEW, PA; Owner: HALL COMMUNICATIONS, INC.)
- WQXA-FM (105.7 FM; YORK, PA; Owner: CITADEL BROADCASTING COMPANY)
- WPLY (100.3 FM; MEDIA, PA; Owner: RADIO ONE LICENSES, LLC)
TV broadcast stations around Leacock-Leola-Bareville:
- WLYH-TV (Channel 15; LANCASTER, PA; Owner: TELEVISION STATION GROUP LICENSE SUBSIDIARY, LLC)
- WPMT (Channel 43; YORK, PA; Owner: TRIBUNE TELEVISION COMPANY)
- WGAL (Channel 8; LANCASTER, PA; Owner: WGAL HEARST-ARGYLE TELEVISION, INC.)
- WTVE (Channel 51; READING, PA; Owner: READING BROADCASTING, INC.)
- WPHL-TV (Channel 17; PHILADELPHIA, PA; Owner: TRIBUNE TELEVISION COMPANY)
- WPPX (Channel 61; WILMINGTON, DE; Owner: PAXSON PHILADELPHIA LICENSE, INC.)
- WTSD-CA (Channel 14; WILMINGTON, DE; Owner: PRIORITY COMMUNICATIONS MINISTRIES, INC.)
- WPVI-TV (Channel 6; PHILADELPHIA, PA; Owner: ABC, INC.)
- WGCB-TV (Channel 49; RED LION, PA; Owner: RED LION BROADCASTING CO., INC.)
- National Bridge Inventory (NBI) Statistics
- 1Number of bridges
- 3ft / 0.8mTotal length
- 500Total average daily traffic
- 25Total average daily truck traffic
- 700Total future (year 2040) average daily traffic
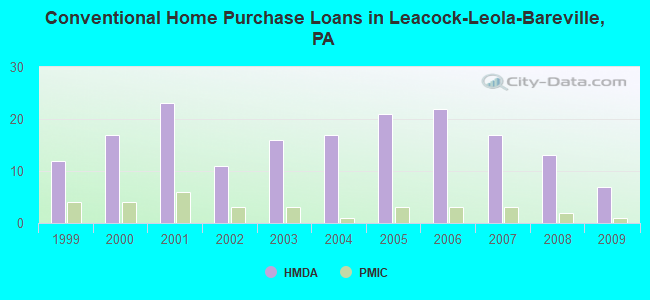
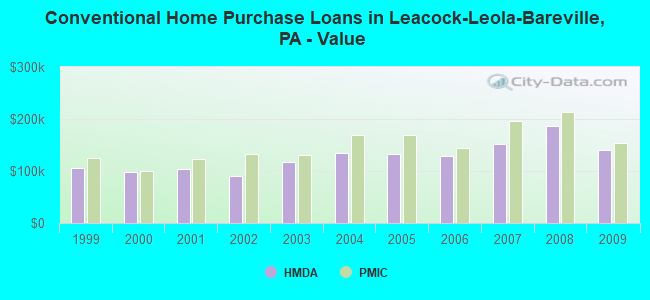
| Home Mortgage Disclosure Act Aggregated Statistics For Year 2009 (Based on 2 partial tracts) | ||||||||||||
| A) FHA, FSA/RHS & VA Home Purchase Loans | B) Conventional Home Purchase Loans | C) Refinancings | D) Home Improvement Loans | F) Non-occupant Loans on < 5 Family Dwellings (A B C & D) | G) Loans On Manufactured Home Dwelling (A B C & D) | |||||||
|---|---|---|---|---|---|---|---|---|---|---|---|---|
| Number | Average Value | Number | Average Value | Number | Average Value | Number | Average Value | Number | Average Value | Number | Average Value | |
| LOANS ORIGINATED | 3 | $175,787 | 7 | $140,931 | 34 | $158,101 | 4 | $87,880 | 3 | $102,770 | 1 | $70,690 |
| APPLICATIONS APPROVED, NOT ACCEPTED | 0 | $0 | 0 | $0 | 1 | $181,680 | 0 | $0 | 0 | $0 | 0 | $0 |
| APPLICATIONS DENIED | 1 | $122,210 | 1 | $211,370 | 9 | $193,054 | 2 | $31,940 | 0 | $0 | 1 | $23,270 |
| APPLICATIONS WITHDRAWN | 0 | $0 | 0 | $0 | 5 | $163,842 | 1 | $306,860 | 1 | $82,480 | 0 | $0 |
| FILES CLOSED FOR INCOMPLETENESS | 0 | $0 | 0 | $0 | 1 | $137,920 | 0 | $0 | 0 | $0 | 0 | $0 |
Detailed HMDA statistics for the following Tracts: 0131.01 , 0131.02
| Private Mortgage Insurance Companies Aggregated Statistics For Year 2009 (Based on 2 partial tracts) | ||
| A) Conventional Home Purchase Loans | ||
|---|---|---|
| Number | Average Value | |
| LOANS ORIGINATED | 1 | $154,530 |
| APPLICATIONS APPROVED, NOT ACCEPTED | 0 | $0 |
| APPLICATIONS DENIED | 0 | $0 |
| APPLICATIONS WITHDRAWN | 0 | $0 |
| FILES CLOSED FOR INCOMPLETENESS | 0 | $0 |
Detailed PMIC statistics for the following Tracts: 0131.01 , 0131.02
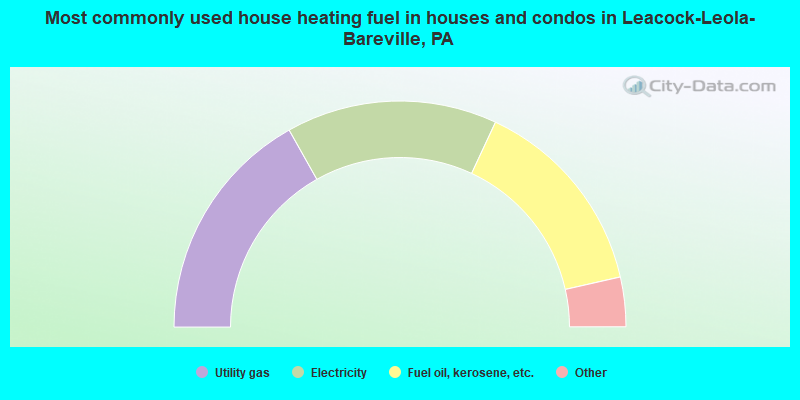
- 33.7%Utility gas
- 30.2%Electricity
- 29.0%Fuel oil, kerosene, etc.
- 3.8%Coal or coke
- 2.2%Bottled, tank, or LP gas
- 1.1%Wood
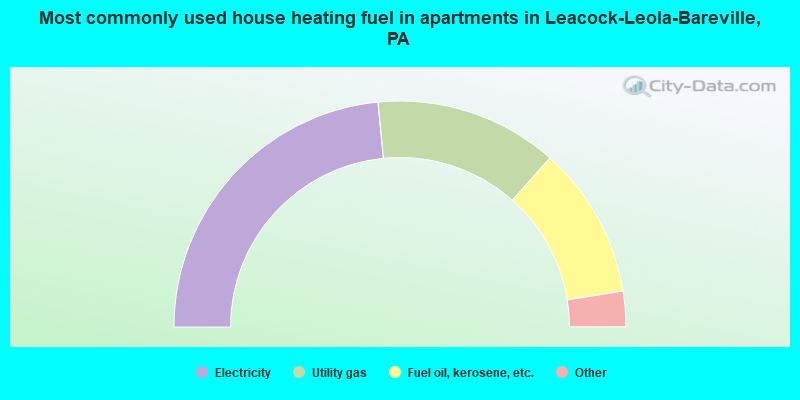
- 46.9%Electricity
- 26.2%Utility gas
- 21.8%Fuel oil, kerosene, etc.
- 2.8%Coal or coke
- 0.9%Wood
- 0.8%Bottled, tank, or LP gas
- 0.8%No fuel used
Leacock-Leola-Bareville compared to Pennsylvania state average:
- Unemployed percentage significantly below state average.
- Black race population percentage significantly below state average.
- Length of stay since moving in significantly above state average.
- Number of rooms per house significantly below state average.
- House age significantly below state average.
- Number of college students below state average.
Leacock-Leola-Bareville on our top lists:
- #10 on the list of "Top 101 cities with largest percentage of females in occupations: laborers and material movers, hand (population 5,000+)"
- #11 on the list of "Top 101 cities with largest percentage of females in occupations: other food preparation and serving workers including supervisors (population 5,000+)"
- #17 on the list of "Top 101 cities with largest percentage of males in industries: warehousing and storage (population 5,000+)"
- #18 on the list of "Top 101 cities with largest percentage of females in industries: food (population 5,000+)"
- #19 on the list of "Top 101 cities with largest percentage of males in industries: printing and related support activities (population 5,000+)"
- #21 on the list of "Top 101 cities with largest percentage of females in industries: plastics and rubber products (population 5,000+)"
- #22 on the list of "Top 101 cities with largest percentage of males in industries: motor vehicles, parts and supplies merchant wholesalers (population 5,000+)"
- #26 on the list of "Top 101 cities with largest percentage of females in industries: food and beverage stores (population 5,000+)"
- #29 on the list of "Top 101 cities with largest percentage of males in occupations: woodworkers (population 5,000+)"
- #33 on the list of "Top 101 cities with largest percentage of males in occupations: printing workers (population 5,000+)"
- #35 on the list of "Top 101 cities with largest percentage of males in industries: sporting goods, camera, and hobby and toy stores (population 5,000+)"
- #35 on the list of "Top 101 cities with largest percentage of males in industries: apparel (population 5,000+)"
- #36 on the list of "Top 101 cities with largest percentage of females in industries: sporting goods, camera, and hobby and toy stores (population 5,000+)"
- #39 on the list of "Top 101 cities with largest percentage of females in industries: farm supplies merchant wholesalers (population 5,000+)"
- #47 on the list of "Top 101 cities with largest percentage of males in industries: farm product raw materials merchant wholesalers (population 5,000+)"
- #52 on the list of "Top 101 cities with largest percentage of females in occupations: special education teachers (population 5,000+)"
- #52 on the list of "Top 101 cities with largest percentage of males in industries: furniture and related product manufacturing (population 5,000+)"
- #56 on the list of "Top 101 cities with largest percentage of females in industries: sewing, needlework, and piece goods stores (population 5,000+)"
- #58 on the list of "Top 101 cities with largest percentage of females in occupations: architects, surveyors, and cartographers (population 5,000+)"
- #59 on the list of "Top 101 cities with largest percentage of males in industries: food (population 5,000+)"
- #39 (17540) on the list of "Top 101 zip codes with the largest percentage of Swiss first ancestries (pop 5,000+)"
- #10 on the list of "Top 101 counties with the lowest percentage of residents relocating to other counties in 2011"
- #14 on the list of "Top 101 counties with the lowest percentage of residents relocating from other counties between 2010 and 2011 (pop. 50,000+)"
- #21 on the list of "Top 101 counties with the most Evangelical Protestant congregations"
- #24 on the list of "Top 101 counties with the most Mainline Protestant congregations"
- #25 on the list of "Top 101 counties with the highest Particulate Matter (PM2.5) Annual air pollution readings in 2012 (µg/m3)"