Estimated zip code population in 2022: 5,312 Zip code population in 2010: 4,424 Zip code population in 2000: 4,217
Houses and condos: 2,261 Renter-occupied apartments: 348
% of renters here:
18%
State:
28%
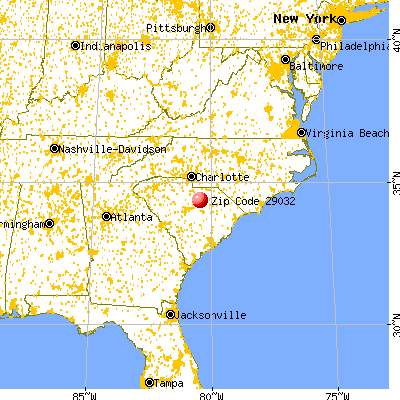
March 2022 cost of living index in zip code 29032: 79.2 (low, U.S. average is 100)
Land area: 79.0 sq. mi. Water area: 0.3 sq. mi.
Population density: 67 people per square mile
(very low).
OSM Map
General Map
Google Map
MSN Map
OSM Map
General Map
Google Map
MSN Map
OSM Map
General Map
Google Map
MSN Map
OSM Map
General Map
Google Map
MSN Map
Please wait while loading the map...
Real estate property taxes paid for housing units in 2022:
This zip code:
0.5% ($556)
South Carolina:
0.5% ($1,185)
Median real estate property taxes paid for housing units with mortgages in 2022: $720 (0.4%) Median real estate property taxes paid for housing units with no mortgage in 2022: $459 (0.6%)
Business Search- 14 Million verified businesses
Males: 2,688
(50.6%)
Females: 2,623
(49.4%)
For population 25 years and over in 29032:
High school or higher: 85.3%
Bachelor's degree or higher: 13.8%
Graduate or professional degree: 3.5%
Unemployed: 5.1%
Mean travel time to work (commute): 35.1 minutes
For population 15 years and over in 29032:
Never married: 28.0%
Now married: 53.7%
Separated: 1.1%
Widowed: 6.0%
Divorced: 11.2%
Zip code 29032 compared to state average:
Median house value significantly below state average.
Hispanic race population percentage significantly below state average.
Foreign-born population percentage below state average.
Renting percentage below state average.
Length of stay since moving in significantly above state average.
Number of college students below state average.
Percentage of population with a bachelor's degree or higher significantly below state average.
Estimated median house/condo value in 2022: $112,933
29032:
$112,933
South Carolina:
$254,600
According to our research of South Carolina and other state lists, there were 5 registered sex offenders living in 29032 zip code as of May 28, 2024. The ratio of all residents to sex offenders in zip code 29032 is 1,055 to 1.
Median resident age:
This zip code:
42.2 years
South Carolina median age:
40.5 years
Average household size:
This zip code:
2.7 people
South Carolina:
2.4 people
Averages for the 2020 tax year for zip code 29032, filed in 2021:
Average Adjusted Gross Income (AGI) in 2020: $38,240 (Individual Income Tax Returns)
Here:
$38,240
State:
$65,754
Salary/wage: $35,159 (reported on 83.7% of returns)
Here:
$35,159
State:
$52,566
(% of AGI for various income ranges: 1198.0% for AGIs below $25k, 3518.6% for AGIs $25k-50k, 6992.4% for AGIs $50k-75k, 11805.7% for AGIs $75k-100k, 18261.7% for AGIs $100k-200k)
Taxable interest for individuals: $350 (reported on 13.0% of returns)
This zip code:
$350
South Carolina:
$1,749
(% of AGI for various income ranges: 2.3% for AGIs below $25k, 1.4% for AGIs $25k-50k, 2.9% for AGIs $50k-75k, 37.1% for AGIs $75k-100k, 53.3% for AGIs $100k-200k)
Ordinary dividends: $1,211 (reported on 4.9% of returns)
Here:
$1,211
State:
$8,783
(% of AGI for various income ranges: 2.9% for AGIs below $25k, 4.9% for AGIs $25k-50k, 24.1% for AGIs $50k-75k, 46.7% for AGIs $100k-200k)
Net capital gain/loss in AGI: +$5,011 (reported on 4.9% of returns)
Here:
+$5,011
State:
+$24,194
(% of AGI for various income ranges: 3.3% for AGIs $25k-50k, 15.9% for AGIs $50k-75k, 683.3% for AGIs $100k-200k)
Profit/loss from business: +$8,341 (reported on 14.7% of returns)
Here:
+$8,341
State:
+$11,253
(% of AGI for various income ranges: 153.8% for AGIs below $25k, 106.3% for AGIs $25k-50k, 234.1% for AGIs $50k-75k, 545.7% for AGIs $75k-100k)
Taxable individual retirement arrangement distribution: $11,220 (reported on 5.4% of returns)
29032:
$11,220
South Carolina:
$21,604
(% of AGI for various income ranges: 18.6% for AGIs below $25k, 77.9% for AGIs $25k-50k, 948.6% for AGIs $75k-100k)
Total itemized deductions: $26,017 (reported on 3.3% of returns)
Here:
$26,017
State:
$35,199
(% of AGI for various income ranges: 585.3% for AGIs $50k-75k, 943.3% for AGIs $100k-200k)
Charity contributions: $10,750 (reported on 2.2% of returns)
Here:
$10,750
State:
$14,319
(% of AGI for various income ranges: 614.3% for AGIs $75k-100k)
Taxes paid: $6,640 (reported on 2.7% of returns)
29032:
$6,640
State:
$7,486
(% of AGI for various income ranges: 100.6% for AGIs $50k-75k, 268.3% for AGIs $100k-200k)
Earned income credit: $2,512 (reported on 30.4% of returns)
Here:
$2,512
State:
$2,397
(% of AGI for various income ranges: 145.2% for AGIs below $25k, 104.4% for AGIs $25k-50k)
Percentage of individuals using paid preparers for their 2020 taxes: 94.6%
Here:
95%
State:
93%
(% for various income ranges: 94.0% for AGIs below $25k, 96.2% for AGIs $25k-50k, 95.8% for AGIs $50k-75k, 91.7% for AGIs $75k-100k, 91.7% for AGIs $100k-200k)
Averages for the 2012 tax year for zip code 29032, filed in 2013:
Average Adjusted Gross Income (AGI) in 2012: $31,404 (Individual Income Tax Returns)
Here:
$31,404
State:
$51,133
Salary/wage: $29,479 (reported on 86.9% of returns)
Here:
$29,479
State:
$42,173
(% of AGI for various income ranges: 76.9% for AGIs below $25k, 86.3% for AGIs $25k-50k, 80.1% for AGIs $50k-75k, 80.5% for AGIs $75k-100k, 81.6% for AGIs $100k-200k)
Taxable interest for individuals: $296 (reported on 15.5% of returns)
This zip code:
$296
South Carolina:
$1,468
(% of AGI for various income ranges: 0.2% for AGIs below $25k, 0.1% for AGIs $25k-50k, 0.1% for AGIs $50k-75k, 0.2% for AGIs $75k-100k)
Ordinary dividends: $567 (reported on 5.4% of returns)
Here:
$567
State:
$6,511
(% of AGI for various income ranges: 0.2% for AGIs below $25k, 0.1% for AGIs $75k-100k)
Net capital gain/loss in AGI: +$1,367 (reported on 3.6% of returns)
Here:
+$1,367
State:
+$13,061
Profit/loss from business: +$7,775 (reported on 14.3% of returns)
Here:
+$7,775
State:
+$10,167
(% of AGI for various income ranges: 9.5% for AGIs below $25k, 2.4% for AGIs $25k-50k, 2.4% for AGIs $50k-75k, 0.7% for AGIs $75k-100k)
Taxable individual retirement arrangement distribution: $7,483 (reported on 3.6% of returns)
29032:
$7,483
South Carolina:
$17,019
Total itemized deductions: $17,765 (27% of AGI, reported on 13.7% of returns)
Here:
$17,765
State:
$22,890
Here:
27.0% of AGI
State:
21.4% of AGI
(% of AGI for various income ranges: 3.7% for AGIs below $25k, 6.3% for AGIs $25k-50k, 9.4% for AGIs $50k-75k, 11.2% for AGIs $75k-100k, 12.8% for AGIs $100k-200k)
Charity contributions: $4,494 (reported on 10.7% of returns)
Here:
$4,494
State:
$5,169
(% of AGI for various income ranges: 0.4% for AGIs below $25k, 1.2% for AGIs $25k-50k, 1.7% for AGIs $50k-75k, 2.5% for AGIs $75k-100k, 3.5% for AGIs $100k-200k)
Taxes paid: $4,665 (reported on 13.7% of returns)
29032:
$4,665
State:
$7,644
(% of AGI for various income ranges: 0.6% for AGIs below $25k, 1.2% for AGIs $25k-50k, 2.2% for AGIs $50k-75k, 3.6% for AGIs $75k-100k, 5.3% for AGIs $100k-200k)
Earned income credit: $2,473 (reported on 37.5% of returns)
Here:
$2,473
State:
$2,418
(% of AGI for various income ranges: 10.5% for AGIs below $25k, 1.7% for AGIs $25k-50k)
Percentage of individuals using paid preparers for their 2012 taxes: 61.9%
Here:
62%
State:
57%
(% for various income ranges: 59.3% for AGIs below $25k, 62.5% for AGIs $25k-50k, 75.0% for AGIs $50k-75k, 66.7% for AGIs $75k-100k, 50.0% for AGIs $100k-200k)
Averages for the 2004 tax year for zip code 29032, filed in 2005:
Average Adjusted Gross Income (AGI) in 2004: $27,618 (Individual Income Tax Returns)
Here:
$27,618
State:
$41,965
Salary/wage: $26,305 (reported on 91.5% of returns)
Here:
$26,305
State:
$35,695
(% of AGI for various income ranges: 108.2% for AGIs below $10k, 84.1% for AGIs $10k-25k, 89.8% for AGIs $25k-50k, 86.0% for AGIs $50k-75k, 83.4% for AGIs $75k-100k, 82.4% for AGIs over 100k)
Taxable interest for individuals: $409 (reported on 24.3% of returns)
This zip code:
$409
South Carolina:
$1,623
(% of AGI for various income ranges: 1.1% for AGIs below $10k, 0.4% for AGIs $10k-25k, 0.3% for AGIs $25k-50k, 0.3% for AGIs $50k-75k, 0.2% for AGIs $75k-100k, 0.4% for AGIs over 100k)
Taxable dividends: $455 (reported on 6.9% of returns)
Here:
$455
State:
$3,999
(% of AGI for various income ranges: 0.9% for AGIs below $10k, 0.2% for AGIs $10k-25k, 0.1% for AGIs $25k-50k, 0.0% for AGIs $50k-75k, 0.0% for AGIs $75k-100k, 0.0% for AGIs over 100k)
Net capital gain/loss: +$149 (reported on 4.1% of returns)
Here:
+$149
State:
+$13,100
(% of AGI for various income ranges: -0.8% for AGIs below $10k, 0.0% for AGIs $10k-25k, 0.1% for AGIs $25k-50k, -0.1% for AGIs $50k-75k, 0.1% for AGIs $75k-100k)
Profit/loss from business: +$3,821 (reported on 11.7% of returns)
Here:
+$3,821
State:
+$9,144
(% of AGI for various income ranges: 5.8% for AGIs below $10k, 3.9% for AGIs $10k-25k, 0.7% for AGIs $25k-50k, 1.4% for AGIs $50k-75k)
IRA payment deduction: $3,067 (reported on 0.9% of returns)
29032:
$3,067
South Carolina:
$2,972
Total itemized deductions: $13,930 (28% of AGI, reported on 20.3% of returns)
Here:
$13,930
State:
$19,039
Here:
27.6% of AGI
State:
22.8% of AGI
(% of AGI for various income ranges: 6.4% for AGIs $10k-25k, 10.8% for AGIs $25k-50k, 11.3% for AGIs $50k-75k, 14.9% for AGIs $75k-100k, 14.7% for AGIs over 100k)
Charity contributions deductions: $2,931 (6% of AGI, reported on 17.0% of returns)
Here:
$2,931
State:
$4,305
Here:
5.6% of AGI
State:
5.0% of AGI
(% of AGI for various income ranges: 1.0% for AGIs $10k-25k, 1.6% for AGIs $25k-50k, 2.0% for AGIs $50k-75k, 3.4% for AGIs $75k-100k, 3.9% for AGIs over 100k)
Total tax: $2,833 (reported on 63.1% of returns)
29032:
$2,833
State:
$6,497
(% of AGI for various income ranges: 2.7% for AGIs below $10k, 3.2% for AGIs $10k-25k, 5.7% for AGIs $25k-50k, 7.8% for AGIs $50k-75k, 9.7% for AGIs $75k-100k, 14.7% for AGIs over 100k)
Earned income credit: $1,965 (reported on 31.2% of returns)
Here:
$1,965
State:
$1,882
Percentage of individuals using paid preparers for their 2004 taxes: 74.9%
Here:
75%
State:
66%
(% for various income ranges: 73.6% for AGIs below $10k, 76.8% for AGIs $10k-25k, 72.8% for AGIs $25k-50k, 80.4% for AGIs $50k-75k, 70.9% for AGIs $75k-100k, 58.3% for AGIs over 100k)
Household received Food Stamps/SNAP in the past 12 months: 485 Household did not receive Food Stamps/SNAP in the past 12 months: 1,491
Women who did not have a birth in the past 12 months: 1,192 (593 now married, 602 unmarried)
Housing units in zip code 29032 with a mortgage: 804 (38 second mortgage, 15 home equity loan, 19 both second mortgage and home equity loan) Houses without a mortgage: 18
Median monthly owner costs for units with a mortgage: $1,044 Median monthly owner costs for units without a mortgage: $319
Residents with income below the poverty level in 2022:
This zip code:
14.6%
Whole state:
14.0%
Residents with income below 50% of the poverty level in 2022:
This zip code:
13.6%
Whole state:
7.3%
Median number of rooms in houses and condos:
Here:
6.2
State:
6.4
Median number of rooms in apartments:
Here:
4.6
State:
4.5
Notable locations in this zip code not listed on our city pages
Notable locations in zip code 29032: Kershaw County Fire Service Cassatt (A), Kershaw County Fire Department Shepard (B). Display/hide their locations on the map
Churches in zip code 29032 include: Cassatt Baptist Church (A), Hyco Baptist Church (B), Cantey Hill Church (C), Marshalls Church (D), Manhaven Church (E), Long Branch Church (F), Beaverdam Church (G), Mount Pisgah Church (H), Red Hill Church (I). Display/hide their locations on the map
Lakes and reservoirs: West Millpond (A), Llewellyn Millpond (B), Hyatts Millpond (C), Hudson Pond (D), Lake Elliott (E), Lewellem Millpond (F), Camden State Park Lake (G), Gogo Pond (H). Display/hide their locations on the map
Streams, rivers, and creeks: Pates Mill Branch (A), Nancy Branch (B), Long Branch (C), Thoroughfare Branch (D), Beaverdam Branch (E). Display/hide their locations on the map
Size of family households: 871 2-persons, 263 3-persons, 298 4-persons, 50 5-persons, 63 6-persons, 69 7-or-more-persons
Size of nonfamily households: 323 1-person, 43 2-persons
586 married couples with children.
333 single-parent households (210 men, 123 women).
97.4% of residents of 29032 zip code speak English at home.
1.6% of residents speak Spanish at home (86% very well, 14% well).
1.2% of residents speak other Indo-European language at home (100% very well).
Foreign born population: 120 (2.3%) (26.4% of them are naturalized citizens)
This zip code:
2.3%
Whole state:
5.2%
37%Grenada
27%Denmark
27%Guatemala
6%Sweden
13%American
10%Irish
5%Scotch-Irish
4%English
4%Italian
4%German
1%Haitian
Year of entry for the foreign-born population
02010 or later
92000 to 2009
311990 to 1999
84Before 1990
Public elementary/middle school in in zip code 29032 not listed on the city page:
Facilities with environmental interests located in this zip code:
COLUMBIA ORGANIC CHEMICAL CO (1 HICKSON CIRCLE in CASSATT, SC)
AIR MINOR (AIRS/AFS) (Integrated Compliance Information System) - ICIS-04-1989-0074, FORMAL ENFORCEMENT ACTION (Resource Conservation and Recovery Act (tracking hazardous waste)) Business SIC classification: INDUSTRIAL ORGANIC CHEMICALS Organizations: OPERNAME (CONTACT/OPERATOR)
, PUBLICALLY HELD (CONTACT/OWNER)
, COLUMBIA ORGANIC CHEMICALS (CONTACT/OWNER)
Alternative names: COLUMBIA ORGANIC CHEM-CLOSED
Housing units lacking complete plumbing facilities: 6.4% Housing units lacking complete kitchen facilities: 3.1%
86.5%Electricity
10.7%Bottled, tank, or LP gas
1.5%No fuel used
1.0%Wood
Population in 1990: 2,164. Population change in the 1990s: +2,053 (+94.9%).
Place of birth for U.S.-born residents:
This state: 3,707
Northeast: 341
Midwest: 209
South: 816
West: 39
54% of the 29032 zip code residents lived in the same house 5 years ago. Out of people who lived in different houses, 50% lived in this county. Out of people who lived in different counties, 50% lived in South Carolina.
91% of the 29032 zip code residents lived in the same house 1 year ago. Out of people who lived in different houses, 72% moved from this county. Out of people who lived in different houses, 2% moved from different county within same state. Out of people who lived in different houses, 16% moved from different state.
Private vs. public school enrollment:
Students in private schools in grades 1 to 8 (elementary and middle school): 65
Here:
12.8%
South Carolina:
14.4%
Students in private schools in grades 9 to 12 (high school): 54
Here:
25.1%
South Carolina:
11.1%
Students in private undergraduate colleges: 45
Here:
32.6%
South Carolina:
21.9%
Occupation by median earnings in the past 12 months ($)
101,623Health diagnosing and treating practitioners and other technical occupations
63,486Installation, maintenance, and repair occupations
58,562Production occupations
53,795Healthcare support occupations
47,109Fire fighting and prevention, and other protective service workers including supervisors
44,359Construction and extraction occupations
Top industries in this zip code by the number of employees in 2005:
Other Services (except Public Administration): General Automotive Repair (10-19 employees: 1 establishment, 1-4 employees: 2 establishments)
Utilities: Water Supply and Irrigation Systems (10-19: 1)
Other Services (except Public Administration): Religious Organizations (1-4: 3)
Construction: New Single-Family Housing Construction (except Operative Builders) (1-4: 3)
Construction: All Other Specialty Trade Contractors (1-4: 1)
Fatal accident statistics in 2014:
Fatal accident count: 1
Vehicles involved in fatal accidents: 2
Fatal accidents caused by drunken drivers: 1
Fatalities: 1
Persons involved in fatal accidents: 7
Pedestrians involved in fatal accidents: 0
Fatal accident statistics in 2012:
Fatal accident count: 1
Vehicles involved in fatal accidents: 3
Fatal accidents caused by drunken drivers: 0
Fatalities: 2
Persons involved in fatal accidents: 4
Pedestrians involved in fatal accidents: 0
Home Mortgage Disclosure Act Aggregated Statistics For Year 2009 (Based on 6 partial tracts)
A) FHA, FSA/RHS & VA Home Purchase Loans
B) Conventional Home Purchase Loans
C) Refinancings
D) Home Improvement Loans
F) Non-occupant Loans on < 5 Family Dwellings (A B C & D)
G) Loans On Manufactured Home Dwelling (A B C & D)
Number
Average Value
Number
Average Value
Number
Average Value
Number
Average Value
Number
Average Value
Number
Average Value
LOANS ORIGINATED
29
$125,940
19
$106,148
96
$124,897
4
$111,120
8
$70,481
7
$50,844
APPLICATIONS APPROVED, NOT ACCEPTED
3
$84,250
4
$142,515
9
$121,230
0
$0
1
$39,190
3
$40,050
APPLICATIONS DENIED
7
$171,766
10
$72,043
61
$102,845
3
$16,007
3
$46,420
9
$44,326
APPLICATIONS WITHDRAWN
3
$144,280
2
$98,765
23
$110,272
2
$16,540
2
$188,945
2
$45,070
FILES CLOSED FOR INCOMPLETENESS
1
$181,590
0
$0
3
$161,767
0
$0
1
$188,950
0
$0
Aggregated Statistics For Year 2008 (Based on 6 partial tracts)
A) FHA, FSA/RHS & VA Home Purchase Loans
B) Conventional Home Purchase Loans
C) Refinancings
D) Home Improvement Loans
F) Non-occupant Loans on < 5 Family Dwellings (A B C & D)
G) Loans On Manufactured Home Dwelling (A B C & D)
Number
Average Value
Number
Average Value
Number
Average Value
Number
Average Value
Number
Average Value
Number
Average Value
LOANS ORIGINATED
26
$120,455
36
$107,408
79
$123,272
7
$47,896
22
$91,819
15
$69,771
APPLICATIONS APPROVED, NOT ACCEPTED
0
$0
15
$134,190
21
$95,220
5
$44,366
3
$44,297
10
$48,134
APPLICATIONS DENIED
4
$140,970
26
$70,861
74
$114,210
13
$41,899
1
$172,020
18
$65,670
APPLICATIONS WITHDRAWN
0
$0
6
$64,400
29
$113,900
2
$103,185
2
$27,795
2
$30,185
FILES CLOSED FOR INCOMPLETENESS
2
$174,180
2
$120,935
8
$107,094
0
$0
0
$0
0
$0
Aggregated Statistics For Year 2007 (Based on 6 partial tracts)
A) FHA, FSA/RHS & VA Home Purchase Loans
B) Conventional Home Purchase Loans
C) Refinancings
D) Home Improvement Loans
F) Non-occupant Loans on < 5 Family Dwellings (A B C & D)
G) Loans On Manufactured Home Dwelling (A B C & D)
Number
Average Value
Number
Average Value
Number
Average Value
Number
Average Value
Number
Average Value
Number
Average Value
LOANS ORIGINATED
14
$110,538
88
$114,664
92
$117,898
26
$50,147
26
$95,343
24
$54,411
APPLICATIONS APPROVED, NOT ACCEPTED
1
$104,800
18
$82,409
19
$94,598
4
$35,592
4
$133,235
7
$54,807
APPLICATIONS DENIED
7
$109,040
16
$75,482
102
$91,762
22
$42,838
7
$80,916
18
$52,676
APPLICATIONS WITHDRAWN
0
$0
11
$123,434
37
$139,615
4
$56,745
3
$72,460
4
$36,882
FILES CLOSED FOR INCOMPLETENESS
0
$0
3
$159,997
12
$158,065
1
$52,490
0
$0
0
$0
Aggregated Statistics For Year 2006 (Based on 6 partial tracts)
A) FHA, FSA/RHS & VA Home Purchase Loans
B) Conventional Home Purchase Loans
C) Refinancings
D) Home Improvement Loans
F) Non-occupant Loans on < 5 Family Dwellings (A B C & D)
G) Loans On Manufactured Home Dwelling (A B C & D)
Number
Average Value
Number
Average Value
Number
Average Value
Number
Average Value
Number
Average Value
Number
Average Value
LOANS ORIGINATED
7
$146,124
82
$91,076
87
$85,344
17
$38,746
29
$69,085
11
$44,721
APPLICATIONS APPROVED, NOT ACCEPTED
1
$163,750
18
$69,344
23
$67,621
3
$41,720
6
$61,038
8
$40,140
APPLICATIONS DENIED
2
$78,730
52
$80,447
71
$80,454
27
$26,813
10
$113,718
33
$47,362
APPLICATIONS WITHDRAWN
2
$67,400
7
$96,449
49
$90,390
6
$60,490
4
$69,590
5
$27,234
FILES CLOSED FOR INCOMPLETENESS
0
$0
3
$245,517
7
$116,574
0
$0
0
$0
0
$0
Aggregated Statistics For Year 2005 (Based on 6 partial tracts)
A) FHA, FSA/RHS & VA Home Purchase Loans
B) Conventional Home Purchase Loans
C) Refinancings
D) Home Improvement Loans
F) Non-occupant Loans on < 5 Family Dwellings (A B C & D)
G) Loans On Manufactured Home Dwelling (A B C & D)
Number
Average Value
Number
Average Value
Number
Average Value
Number
Average Value
Number
Average Value
Number
Average Value
LOANS ORIGINATED
17
$125,777
76
$96,577
93
$98,601
9
$67,382
22
$90,331
23
$60,033
APPLICATIONS APPROVED, NOT ACCEPTED
2
$89,700
11
$78,264
20
$67,996
2
$19,720
2
$38,775
7
$52,550
APPLICATIONS DENIED
3
$98,670
29
$70,388
111
$83,754
23
$37,240
7
$82,501
29
$48,089
APPLICATIONS WITHDRAWN
0
$0
14
$85,895
68
$82,219
7
$66,259
5
$107,804
12
$61,372
FILES CLOSED FOR INCOMPLETENESS
1
$55,980
5
$126,230
15
$101,203
2
$110,945
0
$0
1
$59,540
Aggregated Statistics For Year 2004 (Based on 6 partial tracts)
A) FHA, FSA/RHS & VA Home Purchase Loans
B) Conventional Home Purchase Loans
C) Refinancings
D) Home Improvement Loans
F) Non-occupant Loans on < 5 Family Dwellings (A B C & D)
G) Loans On Manufactured Home Dwelling (A B C & D)
2003 - 2018 National Fire Incident Reporting System (NFIRS) incidents
Based on the data from the years 2003 - 2018 the average number of fires per year is 9. The highest number of fire incidents - 42 took place in 2015, and the least - 0 in 2006. The data has a rising trend.
When looking into fire subcategories, the most reports belonged to: Outside Fires (57.9%), and Structure Fires (32.9%).
Fire incident types reported to NFIRS in Zip Code 29032


 Nearest zip codes: 29009, 29020, 29175, 29010, 29067, 29101.


 (Students: 1,039, Location: 1892 HIGHWAY 1 NORTH, Grades: PK-5)


 Based on the data from the years 2003 - 2018 the average number of fires per year is 9. The highest number of fire incidents - 42 took place in 2015, and the least - 0 in 2006. The data has a rising trend.
 When looking into fire subcategories, the most reports belonged to: Outside Fires (57.9%), and Structure Fires (32.9%).