Estimated zip code population in 2022: 11,063 Zip code population in 2010: 10,949 Zip code population in 2000: 9,991
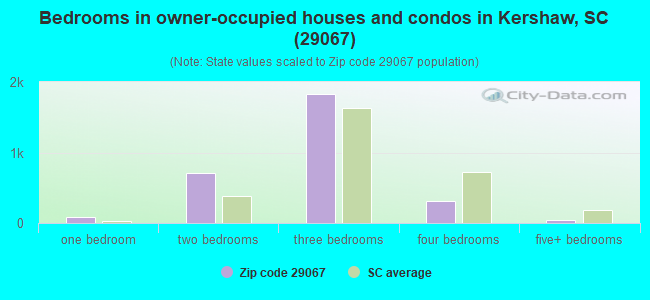
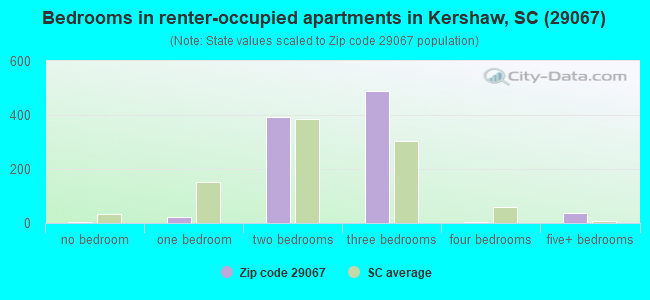
Houses and condos: 4,536 Renter-occupied apartments: 958
% of renters here:
24%
State:
28%
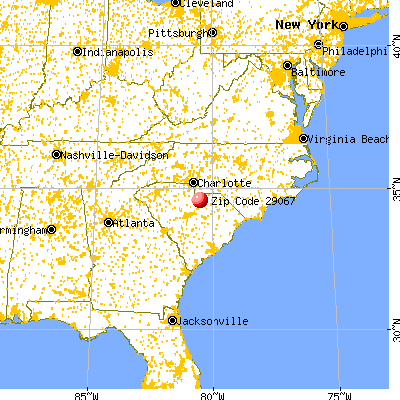
March 2022 cost of living index in zip code 29067: 80.0 (low, U.S. average is 100)
Land area: 195.1 sq. mi. Water area: 0.3 sq. mi.
Population density: 57 people per square mile
(very low).
OSM Map
General Map
Google Map
MSN Map
OSM Map
General Map
Google Map
MSN Map
OSM Map
General Map
Google Map
MSN Map
OSM Map
General Map
Google Map
MSN Map
Please wait while loading the map...
Real estate property taxes paid for housing units in 2022:
This zip code:
0.4% ($525)
South Carolina:
0.5% ($1,185)
Median real estate property taxes paid for housing units with mortgages in 2022: $648 (0.4%) Median real estate property taxes paid for housing units with no mortgage in 2022: $449 (0.5%)
Estimated median house/condo value in 2022: $127,182
29067:
$127,182
South Carolina:
$254,600
According to our research of South Carolina and other state lists, there were 4 registered sex offenders living in 29067 zip code as of June 07, 2024. The ratio of all residents to sex offenders in zip code 29067 is 2,774 to 1. The ratio of registered sex offenders to all residents in this zip code is lower than the state average.
Median resident age:
This zip code:
38.5 years
South Carolina median age:
40.5 years
Average household size:
This zip code:
2.5 people
South Carolina:
2.4 people
Averages for the 2020 tax year for zip code 29067, filed in 2021:
Average Adjusted Gross Income (AGI) in 2020: $46,334 (Individual Income Tax Returns)
Here:
$46,334
State:
$65,754
Salary/wage: $41,576 (reported on 82.3% of returns)
Here:
$41,576
State:
$52,566
(% of AGI for various income ranges: 1064.2% for AGIs below $25k, 3722.4% for AGIs $25k-50k, 6614.0% for AGIs $50k-75k, 10450.0% for AGIs $75k-100k, 15884.2% for AGIs $100k-200k)
Taxable interest for individuals: $970 (reported on 23.6% of returns)
This zip code:
$970
South Carolina:
$1,749
(% of AGI for various income ranges: 16.1% for AGIs below $25k, 18.4% for AGIs $25k-50k, 47.4% for AGIs $50k-75k, 55.2% for AGIs $75k-100k, 74.2% for AGIs $100k-200k)
Ordinary dividends: $3,003 (reported on 8.8% of returns)
Here:
$3,003
State:
$8,783
(% of AGI for various income ranges: 11.5% for AGIs below $25k, 13.5% for AGIs $25k-50k, 51.0% for AGIs $50k-75k, 95.7% for AGIs $75k-100k, 178.4% for AGIs $100k-200k)
Net capital gain/loss in AGI: +$9,575 (reported on 8.6% of returns)
Here:
+$9,575
State:
+$24,194
(% of AGI for various income ranges: 3.2% for AGIs below $25k, 20.5% for AGIs $25k-50k, 52.4% for AGIs $50k-75k, 132.4% for AGIs $75k-100k, 410.5% for AGIs $100k-200k)
Profit/loss from business: +$9,364 (reported on 12.6% of returns)
Here:
+$9,364
State:
+$11,253
(% of AGI for various income ranges: 119.7% for AGIs below $25k, 64.2% for AGIs $25k-50k, 213.1% for AGIs $50k-75k, 212.9% for AGIs $75k-100k, 642.6% for AGIs $100k-200k)
Taxable individual retirement arrangement distribution: $13,839 (reported on 9.7% of returns)
29067:
$13,839
South Carolina:
$21,604
(% of AGI for various income ranges: 77.0% for AGIs below $25k, 100.1% for AGIs $25k-50k, 188.3% for AGIs $50k-75k, 384.3% for AGIs $75k-100k, 902.1% for AGIs $100k-200k)
Total itemized deductions: $30,420 (reported on 2.7% of returns)
Here:
$30,420
State:
$35,199
(% of AGI for various income ranges: 284.3% for AGIs $50k-75k, 972.6% for AGIs $100k-200k)
Charity contributions: $13,989 (reported on 2.4% of returns)
Here:
$13,989
State:
$14,319
(% of AGI for various income ranges: 88.8% for AGIs $50k-75k, 466.3% for AGIs $100k-200k)
Taxes paid: $6,830 (reported on 2.7% of returns)
29067:
$6,830
State:
$7,486
(% of AGI for various income ranges: 50.0% for AGIs $50k-75k, 248.9% for AGIs $100k-200k)
Earned income credit: $2,630 (reported on 23.3% of returns)
Here:
$2,630
State:
$2,397
(% of AGI for various income ranges: 143.8% for AGIs below $25k, 86.9% for AGIs $25k-50k)
Percentage of individuals using paid preparers for their 2020 taxes: 95.4%
Here:
95%
State:
93%
(% for various income ranges: 94.4% for AGIs below $25k, 96.2% for AGIs $25k-50k, 96.6% for AGIs $50k-75k, 96.9% for AGIs $75k-100k, 96.8% for AGIs $100k-200k, 75.0% for AGIs over 200k)
Averages for the 2012 tax year for zip code 29067, filed in 2013:
Average Adjusted Gross Income (AGI) in 2012: $37,851 (Individual Income Tax Returns)
Here:
$37,851
State:
$51,133
Salary/wage: $33,052 (reported on 82.8% of returns)
Here:
$33,052
State:
$42,173
(% of AGI for various income ranges: 70.9% for AGIs below $25k, 79.8% for AGIs $25k-50k, 74.3% for AGIs $50k-75k, 72.9% for AGIs $75k-100k, 62.2% for AGIs $100k-200k)
Taxable interest for individuals: $957 (reported on 27.3% of returns)
This zip code:
$957
South Carolina:
$1,468
(% of AGI for various income ranges: 1.1% for AGIs below $25k, 0.8% for AGIs $25k-50k, 0.7% for AGIs $50k-75k, 0.5% for AGIs $75k-100k, 0.4% for AGIs $100k-200k)
Ordinary dividends: $2,103 (reported on 9.8% of returns)
Here:
$2,103
State:
$6,511
(% of AGI for various income ranges: 0.7% for AGIs below $25k, 0.4% for AGIs $25k-50k, 0.5% for AGIs $50k-75k, 0.8% for AGIs $75k-100k, 0.5% for AGIs $100k-200k)
Net capital gain/loss in AGI: +$12,062 (reported on 7.1% of returns)
Here:
+$12,062
State:
+$13,061
(% of AGI for various income ranges: 0.2% for AGIs $25k-50k, 0.6% for AGIs $50k-75k, 0.6% for AGIs $75k-100k, 9.4% for AGIs $100k-200k)
Profit/loss from business: +$6,874 (reported on 14.8% of returns)
Here:
+$6,874
State:
+$10,167
(% of AGI for various income ranges: 7.8% for AGIs below $25k, 1.8% for AGIs $25k-50k, 1.8% for AGIs $50k-75k, 0.7% for AGIs $75k-100k, 2.3% for AGIs $100k-200k)
Taxable individual retirement arrangement distribution: $12,228 (reported on 12.8% of returns)
29067:
$12,228
South Carolina:
$17,019
(% of AGI for various income ranges: 4.9% for AGIs below $25k, 3.8% for AGIs $25k-50k, 3.8% for AGIs $50k-75k, 4.9% for AGIs $75k-100k, 3.6% for AGIs $100k-200k)
Total itemized deductions: $18,282 (24% of AGI, reported on 19.6% of returns)
Here:
$18,282
State:
$22,890
Here:
24.0% of AGI
State:
21.4% of AGI
(% of AGI for various income ranges: 5.2% for AGIs below $25k, 7.2% for AGIs $25k-50k, 8.9% for AGIs $50k-75k, 11.1% for AGIs $75k-100k, 14.5% for AGIs $100k-200k)
Charity contributions: $5,173 (reported on 16.6% of returns)
Here:
$5,173
State:
$5,169
(% of AGI for various income ranges: 0.9% for AGIs below $25k, 1.8% for AGIs $25k-50k, 1.8% for AGIs $50k-75k, 2.6% for AGIs $75k-100k, 4.1% for AGIs $100k-200k)
Taxes paid: $5,091 (reported on 19.6% of returns)
29067:
$5,091
State:
$7,644
(% of AGI for various income ranges: 0.6% for AGIs below $25k, 1.3% for AGIs $25k-50k, 2.2% for AGIs $50k-75k, 3.5% for AGIs $75k-100k, 5.4% for AGIs $100k-200k)
Earned income credit: $2,424 (reported on 28.2% of returns)
Here:
$2,424
State:
$2,418
(% of AGI for various income ranges: 9.0% for AGIs below $25k, 1.5% for AGIs $25k-50k)
Percentage of individuals using paid preparers for their 2012 taxes: 68.2%
Here:
68%
State:
57%
(% for various income ranges: 63.4% for AGIs below $25k, 70.5% for AGIs $25k-50k, 75.6% for AGIs $50k-75k, 75.0% for AGIs $75k-100k, 73.7% for AGIs $100k-200k)
Averages for the 2004 tax year for zip code 29067, filed in 2005:
Average Adjusted Gross Income (AGI) in 2004: $32,956 (Individual Income Tax Returns)
Here:
$32,956
State:
$41,965
Salary/wage: $28,809 (reported on 87.7% of returns)
Here:
$28,809
State:
$35,695
(% of AGI for various income ranges: 97.0% for AGIs below $10k, 80.0% for AGIs $10k-25k, 80.4% for AGIs $25k-50k, 80.7% for AGIs $50k-75k, 81.1% for AGIs $75k-100k, 48.0% for AGIs over 100k)
Taxable interest for individuals: $1,135 (reported on 38.9% of returns)
This zip code:
$1,135
South Carolina:
$1,623
(% of AGI for various income ranges: 5.4% for AGIs below $10k, 1.4% for AGIs $10k-25k, 1.0% for AGIs $25k-50k, 0.9% for AGIs $50k-75k, 1.4% for AGIs $75k-100k, 1.9% for AGIs over 100k)
Taxable dividends: $2,126 (reported on 10.5% of returns)
Here:
$2,126
State:
$3,999
(% of AGI for various income ranges: 1.7% for AGIs below $10k, 0.5% for AGIs $10k-25k, 0.4% for AGIs $25k-50k, 0.4% for AGIs $50k-75k, 0.7% for AGIs $75k-100k, 2.0% for AGIs over 100k)
Net capital gain/loss: +$6,029 (reported on 7.9% of returns)
Here:
+$6,029
State:
+$13,100
(% of AGI for various income ranges: -1.4% for AGIs below $10k, 0.3% for AGIs $10k-25k, 0.3% for AGIs $25k-50k, 0.8% for AGIs $50k-75k, 0.6% for AGIs $75k-100k, 8.0% for AGIs over 100k)
Profit/loss from business: +$5,927 (reported on 11.4% of returns)
Here:
+$5,927
State:
+$9,144
(% of AGI for various income ranges: 8.2% for AGIs below $10k, 2.6% for AGIs $10k-25k, 2.4% for AGIs $25k-50k, 1.3% for AGIs $50k-75k, 0.7% for AGIs $75k-100k, 2.2% for AGIs over 100k)
IRA payment deduction: $2,965 (reported on 1.6% of returns)
29067:
$2,965
South Carolina:
$2,972
Total itemized deductions: $15,135 (24% of AGI, reported on 22.3% of returns)
Here:
$15,135
State:
$19,039
Here:
23.5% of AGI
State:
22.8% of AGI
(% of AGI for various income ranges: 3.1% for AGIs below $10k, 5.6% for AGIs $10k-25k, 8.0% for AGIs $25k-50k, 11.3% for AGIs $50k-75k, 16.1% for AGIs $75k-100k, 14.9% for AGIs over 100k)
Charity contributions deductions: $4,660 (7% of AGI, reported on 19.6% of returns)
Here:
$4,660
State:
$4,305
Here:
6.9% of AGI
State:
5.0% of AGI
(% of AGI for various income ranges: 1.2% for AGIs $10k-25k, 1.7% for AGIs $25k-50k, 2.8% for AGIs $50k-75k, 3.9% for AGIs $75k-100k, 6.6% for AGIs over 100k)
Total tax: $3,633 (reported on 70.0% of returns)
29067:
$3,633
State:
$6,497
(% of AGI for various income ranges: 2.6% for AGIs below $10k, 3.2% for AGIs $10k-25k, 6.3% for AGIs $25k-50k, 8.2% for AGIs $50k-75k, 9.9% for AGIs $75k-100k, 14.7% for AGIs over 100k)
Earned income credit: $1,826 (reported on 24.1% of returns)
Here:
$1,826
State:
$1,882
Percentage of individuals using paid preparers for their 2004 taxes: 75.6%
Here:
76%
State:
66%
(% for various income ranges: 70.6% for AGIs below $10k, 77.5% for AGIs $10k-25k, 75.1% for AGIs $25k-50k, 78.4% for AGIs $50k-75k, 76.9% for AGIs $75k-100k, 78.2% for AGIs over 100k)
Likely homosexual households (counted as self-reported same-sex unmarried-partner households)
Lesbian couples: 0.0% of all households
Gay men: 0.3% of all households
Household received Food Stamps/SNAP in the past 12 months: 708 Household did not receive Food Stamps/SNAP in the past 12 months: 3,269
Women who had a birth in the past 12 months: 177 (139 now married, 42 unmarried) Women who did not have a birth in the past 12 months: 1,674 (967 now married, 716 unmarried)
Housing units in zip code 29067 with a mortgage: 1,011 (27 second mortgage, 11 both second mortgage and home equity loan) Houses without a mortgage: 39
Median monthly owner costs for units with a mortgage: $954 Median monthly owner costs for units without a mortgage: $337
Residents with income below the poverty level in 2022:
This zip code:
14.5%
Whole state:
14.0%
Residents with income below 50% of the poverty level in 2022:
This zip code:
9.2%
Whole state:
7.3%
Median number of rooms in houses and condos:
Here:
5.9
State:
6.4
Median number of rooms in apartments:
Here:
5.4
State:
4.5
Notable locations in this zip code not listed on our city pages
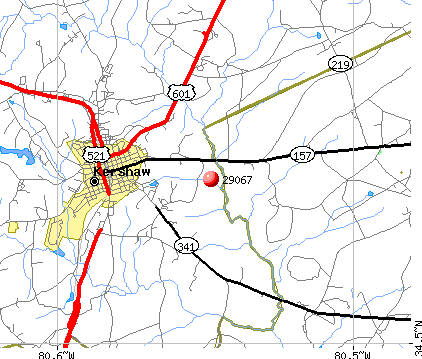
Notable locations in zip code 29067: Hanging Rock Battleground (A), Flat Creek Fire Department Substation (B), Kershaw County Fire Department North Central (C), Kershaw County Fire Department Gates Ford (D), Kershaw City Hall (E), Kershaw County Fire Station Buffalo Mount Pisgah (F), Flat Creek Fire Department Station 7 (G), Kershaw Fire Department Station 11 (H). Display/hide their locations on the map
Churches in zip code 29067 include: Rocky Branch Baptist Church (A), Sand Hill Church (B), Pleasant Grove Church (C), White Bluff Baptist Church (D), Unity Baptist Church (E), Pleasant Plain Baptist Church (F), Kershaw Presbyterian Church (G), First United Methodist Church of Kershaw (H), First Baptist Church of North Hampton Street (I). Display/hide their locations on the map
Cemeteries: Laurel Hill Cemetery (1), Blackman Cemetery (2), Beaver Creek Cemetery (3), Hanging Rock Cemetery (4), Stroud Cemetery (5). Display/hide their locations on the map
Reservoirs: Lindenzwiegs Pond (A), City Reservoir (B), Taylors Pond (C), Baxley Pond (D), Horton Pond (E), George West Pond (F), Little Barfield Millpond (G), William Holly Pond (H). Display/hide their locations on the map
Streams, rivers, and creeks: Gates Ford Branch (A), Neds Creek (B), Mill Creek (C), Mill Branch (D), Little Double Branch (E), Lick Run (F), Horton Spring Branch (G), Horton Creek (H), Hanging Rock Creek (I). Display/hide their locations on the map
Parks in zip code 29067 include: Matson Street Historic District (1), East Richland Street - East Church Street Historic District (2), Stevens Acres (3), Stevens Park (4). Display/hide their locations on the map
In group quarters: 1,119 (-1 institutionalized population)
Size of family households: 1,233 2-persons, 710 3-persons, 310 4-persons, 232 5-persons, 49 6-persons, 38 7-or-more-persons
Size of nonfamily households: 1,246 1-person, 142 2-persons
1,656 married couples with children.
698 single-parent households (99 men, 599 women).
98.0% of residents of 29067 zip code speak English at home.
0.9% of residents speak Spanish at home (79% very well, 2% well, 19% not well).
0.7% of residents speak other Indo-European language at home (65% very well, 35% well).
0.2% of residents speak Asian or Pacific Island language at home (100% very well).
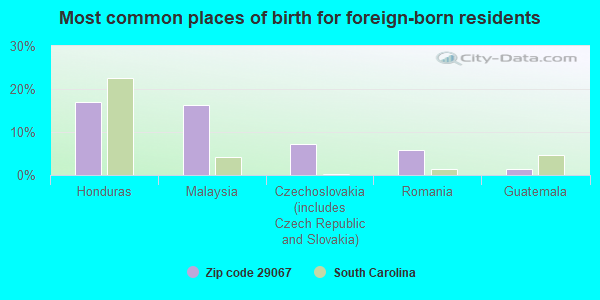
Foreign born population: 158 (1.4%) (67.8% of them are naturalized citizens)
This zip code:
1.4%
Whole state:
5.2%
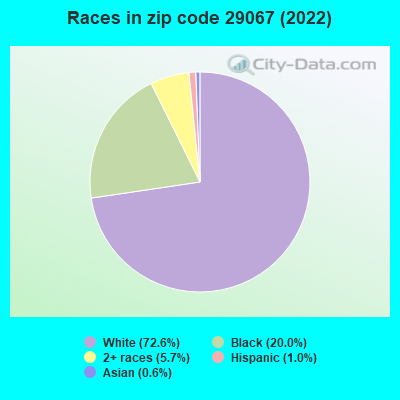
17%Honduras
16%Malaysia
7%Czechoslovakia (includes Czech Republic and Slovakia)
6%Romania
1%Guatemala
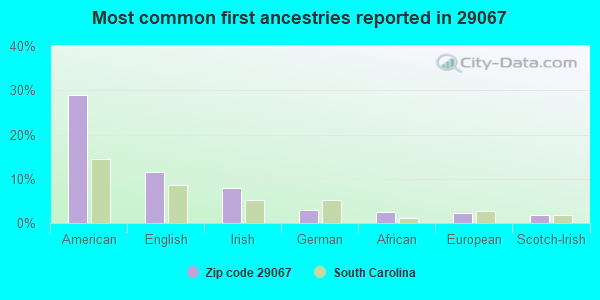
29%American
12%English
8%Irish
3%German
3%African
2%European
2%Scotch-Irish
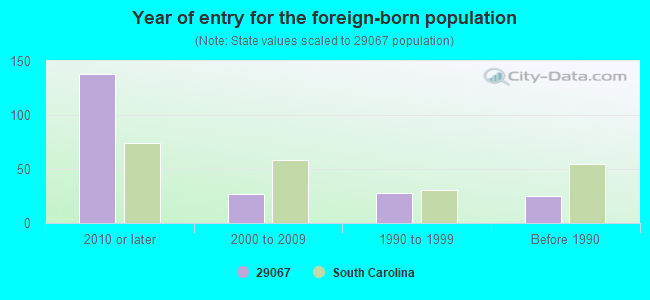
Year of entry for the foreign-born population
1382010 or later
272000 to 2009
281990 to 1999
25Before 1990
Facilities with environmental interests located in this zip code:
ANDREW JACKSON HIGH SCHOOL (6925 KERSHAW-CAMDEN HWY in KERSHAW, SC)
(Geographic Names Information System) (National Center for Education Statistics) - STATE ID-2901007 Conditionally Exempt Small Quantity Generators, less than 100 kg/month of hazardous waste (Resource Conservation and Recovery Act (tracking hazardous waste)) - notification STATE MASTER (South Carolina database) - National Pollutant Discharge Elimination System Permit, HAZARDOUS WASTE PROGRAM Organizations: LANCASTER CO SCHOOL DISTRICT (CONTACT/OWNER)
, LANCASTER COUNTY SCHOOL DISTRICT (SCHOOL DISTRICT)
ALLTEL SOUTH CAROLINA INCORPORATED (105 NORTH CLEVELAND STREET in KERSHAW, SC)
(Integrated Compliance Information System) - ICIS-HQ-2000-6004, FORMAL ENFORCEMENT ACTION STATE MASTER (South Carolina database) - UNDERGROUND STORAGE TANK PROGRAM
ADM (413 NORTH HAMPTON STREET in KERSHAW, SC)
AIR MAJOR (AIRS/AFS) OIL CONTROL (Facility Response Plan for oil discharge) CRITERIA AND HAZARDOUS AIR POLLUTANT INVENTORY (Inventory of air pollution sources) National Pollutant Discharge Elimination System NON-MAJOR (Tracking pollutant discharge elimination systems) - permit Conditionally Exempt Small Quantity Generators, less than 100 kg/month of hazardous waste (Resource Conservation and Recovery Act (tracking hazardous waste)) - notification TRI REPORTER (Tracking of toxic chemicals releasing facilities) Business SIC classification: SOYBEAN OIL MILLS Organizations: ARCHER DANIELS MIDLAND COMPANY (CONTACT/GENERAL)
, ARCHER DANIELS MIDLAND CO (CONTACT/OWNER)
Alternative names: ARCHER DANIELS MIDLAND CO, ARCHER DANIELS MIDLAND COMPANY, ARCHER DANIELS MIDLAND CO., KERSHAW, SC FACILITY
AT&T KERSHAW (RD S29 75 1.5 MI W OF in KERSHAW, SC)
(Resource Conservation and Recovery Act (tracking hazardous waste)) STATE MASTER (South Carolina database) - HAZARDOUS WASTE PROGRAM Organizations: AT & T (CONTACT/OWNER)
Alternative names: AT&T - KERSHAW (DEACTIVATED)
ANDREW JACKSON MIDDLE SCHOOL (6865 KERSHAW-CAMDEN HWY in KERSHAW, SC)
(Geographic Names Information System) (National Center for Education Statistics) - STATE ID-2901027 Organizations: LANCASTER COUNTY SCHOOL DISTRICT (SCHOOL DISTRICT)
CAROLINA QUARRIES-KERSHAW SITE (2548 FLAT RD in KERSHAW, SC)
AIR MINOR (AIRS/AFS) National Pollutant Discharge Elimination System NON-MAJOR (Tracking pollutant discharge elimination systems) - permit Business SIC classification: DIMENSION STONE; SERVICES Organizations: CAROLINA QUARRIES/KERSHAW QUAR (CONTACT/OWNER)
Alternative names: CAROLINA QUARRIES/KERSHAW QUAR
Housing units lacking complete plumbing facilities: 5.9% Housing units lacking complete kitchen facilities: 7.4%
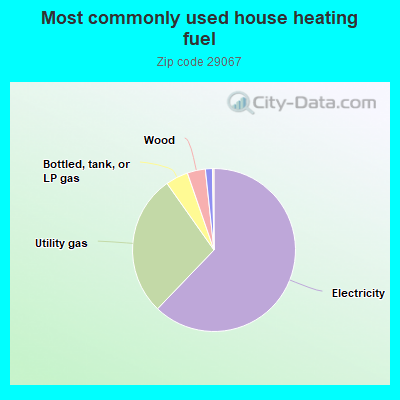
62.3%Electricity
28.1%Utility gas
4.5%Bottled, tank, or LP gas
3.6%Wood
1.4%Fuel oil, kerosene, etc.
Population in 1990: 8,189. Population change in the 1990s: +1,802 (+22.0%).
Place of birth for U.S.-born residents:
This state: 7,854
Northeast: 651
Midwest: 432
South: 1,572
West: 220
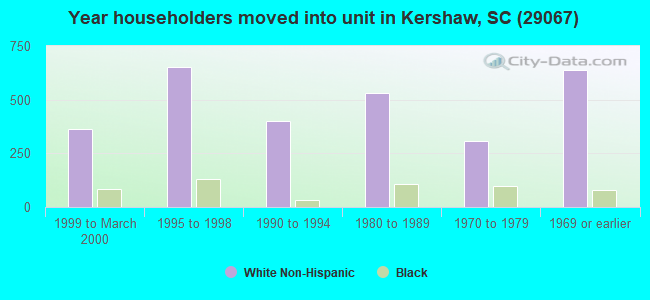
61% of the 29067 zip code residents lived in the same house 5 years ago. Out of people who lived in different houses, 43% lived in this county. Out of people who lived in different counties, 50% lived in South Carolina.
90% of the 29067 zip code residents lived in the same house 1 year ago. Out of people who lived in different houses, 10% moved from this county. Out of people who lived in different houses, 70% moved from different county within same state. Out of people who lived in different houses, 16% moved from different state. Out of people who lived in different houses, 9% moved from abroad.
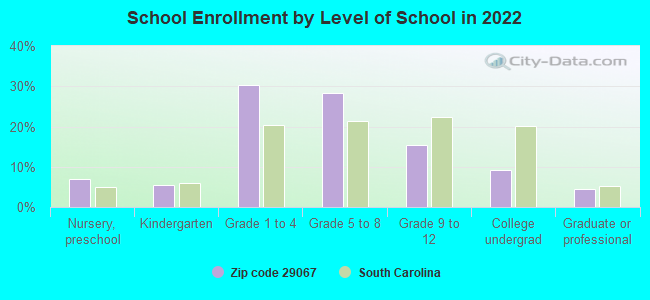
Private vs. public school enrollment:
Students in private schools in grades 1 to 8 (elementary and middle school): 96
Here:
7.1%
South Carolina:
14.4%
Students in private schools in grades 9 to 12 (high school): 18
Here:
5.2%
South Carolina:
11.1%
Students in private undergraduate colleges: 12
Here:
5.8%
South Carolina:
21.9%
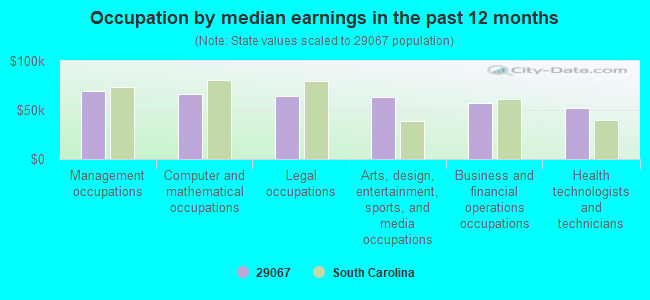
Occupation by median earnings in the past 12 months ($)
69,709Management occupations
66,055Computer and mathematical occupations
64,422Legal occupations
63,193Arts, design, entertainment, sports, and media occupations
57,210Business and financial operations occupations
52,251Health technologists and technicians
Top industries in this zip code by the number of employees in 2005:
Detailed PMIC statistics for the following Tracts:9702.00
, 9703.00
2003 - 2018 National Fire Incident Reporting System (NFIRS) incidents
According to the data from the years 2003 - 2018 the average number of fires per year is 99. The highest number of fire incidents - 143 took place in 2018, and the least - 22 in 2003. The data has a rising trend.
When looking into fire subcategories, the most reports belonged to: Structure Fires (45.6%), and Outside Fires (42.5%).
Fire incident types reported to NFIRS in Zip Code 29067


 Nearest zip codes: 29175, 29009, 29058, 29032, 29718, 29020.


 According to the data from the years 2003 - 2018 the average number of fires per year is 99. The highest number of fire incidents - 143 took place in 2018, and the least - 22 in 2003. The data has a rising trend.
 When looking into fire subcategories, the most reports belonged to: Structure Fires (45.6%), and Outside Fires (42.5%).