Estimated zip code population in 2022: 5,773 Zip code population in 2010: 4,746 Zip code population in 2000: 4,618
Houses and condos: 2,286 Renter-occupied apartments: 497
% of renters here:
25%
State:
28%
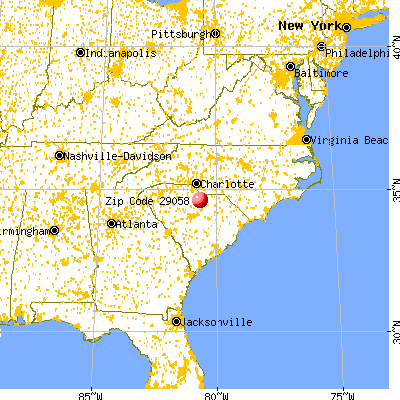
March 2022 cost of living index in zip code 29058: 80.3 (low, U.S. average is 100)
Land area: 142.0 sq. mi. Water area: 1.6 sq. mi.
Population density: 41 people per square mile
(very low).
OSM Map
General Map
Google Map
MSN Map
OSM Map
General Map
Google Map
MSN Map
OSM Map
General Map
Google Map
MSN Map
OSM Map
General Map
Google Map
MSN Map
Please wait while loading the map...
Real estate property taxes paid for housing units in 2022:
This zip code:
0.4% ($843)
South Carolina:
0.5% ($1,185)
Median real estate property taxes paid for housing units with mortgages in 2022: $1,019 (0.4%) Median real estate property taxes paid for housing units with no mortgage in 2022: $509 (0.4%)
Business Search- 14 Million verified businesses
Males: 3,065
(53.1%)
Females: 2,706
(46.9%)
For population 25 years and over in 29058:
High school or higher: 89.0%
Bachelor's degree or higher: 14.6%
Graduate or professional degree: 6.7%
Unemployed: 4.6%
Mean travel time to work (commute): 32.9 minutes
For population 15 years and over in 29058:
Never married: 29.6%
Now married: 57.8%
Separated: 0.9%
Widowed: 4.3%
Divorced: 7.5%
Zip code 29058 compared to state average:
Black race population percentage below state average.
Hispanic race population percentage significantly below state average.
Foreign-born population percentage significantly below state average.
Length of stay since moving in significantly above state average.
Percentage of population with a bachelor's degree or higher significantly below state average.
Estimated median house/condo value in 2022: $198,781
29058:
$198,781
South Carolina:
$254,600
According to our research of South Carolina and other state lists, there were 3 registered sex offenders living in 29058 zip code as of May 28, 2024. The ratio of all residents to sex offenders in zip code 29058 is 1,616 to 1. The ratio of registered sex offenders to all residents in this zip code is lower than the state average.
Median resident age:
This zip code:
36.8 years
South Carolina median age:
40.5 years
Average household size:
This zip code:
2.9 people
South Carolina:
2.4 people
Averages for the 2020 tax year for zip code 29058, filed in 2021:
Average Adjusted Gross Income (AGI) in 2020: $45,594 (Individual Income Tax Returns)
Here:
$45,594
State:
$65,754
Salary/wage: $41,614 (reported on 85.5% of returns)
Here:
$41,614
State:
$52,566
(% of AGI for various income ranges: 1305.5% for AGIs below $25k, 3774.0% for AGIs $25k-50k, 6860.0% for AGIs $50k-75k, 10126.2% for AGIs $75k-100k, 14481.7% for AGIs $100k-200k)
Taxable interest for individuals: $1,375 (reported on 22.4% of returns)
This zip code:
$1,375
South Carolina:
$1,749
(% of AGI for various income ranges: 6.8% for AGIs below $25k, 21.7% for AGIs $25k-50k, 40.0% for AGIs $50k-75k, 30.0% for AGIs $75k-100k, 75.0% for AGIs $100k-200k)
Ordinary dividends: $2,420 (reported on 7.0% of returns)
Here:
$2,420
State:
$8,783
(% of AGI for various income ranges: 25.0% for AGIs $25k-50k, 16.8% for AGIs $50k-75k, 10.8% for AGIs $75k-100k, 164.2% for AGIs $100k-200k)
Net capital gain/loss in AGI: +$4,829 (reported on 6.5% of returns)
Here:
+$4,829
State:
+$24,194
(% of AGI for various income ranges: 5.6% for AGIs below $25k, 7.5% for AGIs $25k-50k, 66.3% for AGIs $50k-75k, 399.2% for AGIs $100k-200k)
Profit/loss from business: +$7,216 (reported on 14.5% of returns)
Here:
+$7,216
State:
+$11,253
(% of AGI for various income ranges: 137.9% for AGIs below $25k, 72.1% for AGIs $25k-50k, 343.7% for AGIs $50k-75k, 23.1% for AGIs $75k-100k, 294.2% for AGIs $100k-200k)
Taxable individual retirement arrangement distribution: $13,319 (reported on 9.8% of returns)
29058:
$13,319
South Carolina:
$21,604
(% of AGI for various income ranges: 56.8% for AGIs below $25k, 134.0% for AGIs $25k-50k, 268.4% for AGIs $50k-75k, 329.2% for AGIs $75k-100k, 720.0% for AGIs $100k-200k)
Total itemized deductions: $33,586 (reported on 3.3% of returns)
Here:
$33,586
State:
$35,199
(% of AGI for various income ranges: 608.4% for AGIs $50k-75k, 995.8% for AGIs $100k-200k)
Charity contributions: $10,617 (reported on 2.8% of returns)
Here:
$10,617
State:
$14,319
(% of AGI for various income ranges: 117.4% for AGIs $50k-75k, 345.0% for AGIs $100k-200k)
Taxes paid: $7,329 (reported on 3.3% of returns)
29058:
$7,329
State:
$7,486
(% of AGI for various income ranges: 106.8% for AGIs $50k-75k, 258.3% for AGIs $100k-200k)
Earned income credit: $2,269 (reported on 24.3% of returns)
Here:
$2,269
State:
$2,397
(% of AGI for various income ranges: 124.8% for AGIs below $25k, 84.6% for AGIs $25k-50k)
Percentage of individuals using paid preparers for their 2020 taxes: 96.3%
Here:
96%
State:
93%
(% for various income ranges: 95.3% for AGIs below $25k, 96.8% for AGIs $25k-50k, 96.3% for AGIs $50k-75k, 100.0% for AGIs $75k-100k, 94.4% for AGIs $100k-200k, 100.0% for AGIs over 200k)
Averages for the 2012 tax year for zip code 29058, filed in 2013:
Average Adjusted Gross Income (AGI) in 2012: $37,639 (Individual Income Tax Returns)
Here:
$37,639
State:
$51,133
Salary/wage: $33,919 (reported on 84.6% of returns)
Here:
$33,919
State:
$42,173
(% of AGI for various income ranges: 73.4% for AGIs below $25k, 82.7% for AGIs $25k-50k, 76.7% for AGIs $50k-75k, 78.0% for AGIs $75k-100k, 68.6% for AGIs $100k-200k)
Taxable interest for individuals: $1,132 (reported on 23.4% of returns)
This zip code:
$1,132
South Carolina:
$1,468
(% of AGI for various income ranges: 0.9% for AGIs below $25k, 0.4% for AGIs $25k-50k, 0.4% for AGIs $50k-75k, 0.6% for AGIs $75k-100k, 1.3% for AGIs $100k-200k)
Ordinary dividends: $1,100 (reported on 8.0% of returns)
Here:
$1,100
State:
$6,511
(% of AGI for various income ranges: 0.3% for AGIs below $25k, 0.1% for AGIs $25k-50k, 0.3% for AGIs $50k-75k, 0.3% for AGIs $75k-100k, 0.2% for AGIs $100k-200k)
Net capital gain/loss in AGI: +$550 (reported on 6.4% of returns)
Here:
+$550
State:
+$13,061
(% of AGI for various income ranges: 0.4% for AGIs $50k-75k, 0.1% for AGIs $100k-200k)
Profit/loss from business: +$7,003 (reported on 17.0% of returns)
Here:
+$7,003
State:
+$10,167
(% of AGI for various income ranges: 8.1% for AGIs below $25k, 1.7% for AGIs $25k-50k, 2.4% for AGIs $50k-75k, 1.6% for AGIs $75k-100k, 3.0% for AGIs $100k-200k)
Taxable individual retirement arrangement distribution: $12,843 (reported on 12.2% of returns)
29058:
$12,843
South Carolina:
$17,019
(% of AGI for various income ranges: 5.0% for AGIs below $25k, 3.8% for AGIs $25k-50k, 3.9% for AGIs $50k-75k, 4.8% for AGIs $75k-100k, 3.9% for AGIs $100k-200k)
Total itemized deductions: $18,100 (25% of AGI, reported on 22.3% of returns)
Here:
$18,100
State:
$22,890
Here:
24.8% of AGI
State:
21.4% of AGI
(% of AGI for various income ranges: 6.1% for AGIs below $25k, 7.4% for AGIs $25k-50k, 11.6% for AGIs $50k-75k, 13.2% for AGIs $75k-100k, 16.0% for AGIs $100k-200k)
Charity contributions: $4,951 (reported on 19.7% of returns)
Here:
$4,951
State:
$5,169
(% of AGI for various income ranges: 0.9% for AGIs below $25k, 1.9% for AGIs $25k-50k, 3.1% for AGIs $50k-75k, 3.2% for AGIs $75k-100k, 3.8% for AGIs $100k-200k)
Taxes paid: $5,207 (reported on 22.3% of returns)
29058:
$5,207
State:
$7,644
(% of AGI for various income ranges: 0.9% for AGIs below $25k, 1.5% for AGIs $25k-50k, 3.0% for AGIs $50k-75k, 4.1% for AGIs $75k-100k, 6.2% for AGIs $100k-200k)
Earned income credit: $2,391 (reported on 28.2% of returns)
Here:
$2,391
State:
$2,418
(% of AGI for various income ranges: 8.2% for AGIs below $25k, 1.7% for AGIs $25k-50k)
Percentage of individuals using paid preparers for their 2012 taxes: 75.5%
Here:
76%
State:
57%
(% for various income ranges: 69.3% for AGIs below $25k, 79.2% for AGIs $25k-50k, 83.3% for AGIs $50k-75k, 83.3% for AGIs $75k-100k, 81.8% for AGIs $100k-200k)
Averages for the 2004 tax year for zip code 29058, filed in 2005:
Average Adjusted Gross Income (AGI) in 2004: $33,241 (Individual Income Tax Returns)
Here:
$33,241
State:
$41,965
Salary/wage: $29,731 (reported on 90.7% of returns)
Here:
$29,731
State:
$35,695
(% of AGI for various income ranges: 87.2% for AGIs below $10k, 79.9% for AGIs $10k-25k, 86.9% for AGIs $25k-50k, 84.5% for AGIs $50k-75k, 80.8% for AGIs $75k-100k, 60.1% for AGIs over 100k)
Taxable interest for individuals: $870 (reported on 36.6% of returns)
This zip code:
$870
South Carolina:
$1,623
(% of AGI for various income ranges: 1.0% for AGIs below $10k, 1.3% for AGIs $10k-25k, 1.1% for AGIs $25k-50k, 0.5% for AGIs $50k-75k, 0.5% for AGIs $75k-100k, 1.4% for AGIs over 100k)
Taxable dividends: $1,212 (reported on 9.5% of returns)
Here:
$1,212
State:
$3,999
(% of AGI for various income ranges: 1.4% for AGIs below $10k, 0.5% for AGIs $10k-25k, 0.3% for AGIs $25k-50k, 0.1% for AGIs $50k-75k, 0.2% for AGIs $75k-100k, 0.7% for AGIs over 100k)
Net capital gain/loss: +$1,282 (reported on 7.3% of returns)
Here:
+$1,282
State:
+$13,100
(% of AGI for various income ranges: 0.2% for AGIs below $10k, -0.1% for AGIs $10k-25k, -0.0% for AGIs $25k-50k, 0.3% for AGIs $50k-75k, 0.1% for AGIs $75k-100k, 1.8% for AGIs over 100k)
Profit/loss from business: +$7,878 (reported on 12.9% of returns)
Here:
+$7,878
State:
+$9,144
(% of AGI for various income ranges: 4.3% for AGIs below $10k, 4.9% for AGIs $10k-25k, 1.4% for AGIs $25k-50k, 2.8% for AGIs $50k-75k, 1.7% for AGIs $75k-100k, 6.4% for AGIs over 100k)
IRA payment deduction: $2,704 (reported on 1.3% of returns)
29058:
$2,704
South Carolina:
$2,972
Total itemized deductions: $15,164 (25% of AGI, reported on 25.1% of returns)
Here:
$15,164
State:
$19,039
Here:
24.7% of AGI
State:
22.8% of AGI
(% of AGI for various income ranges: 6.2% for AGIs $10k-25k, 9.7% for AGIs $25k-50k, 13.6% for AGIs $50k-75k, 19.1% for AGIs $75k-100k, 13.2% for AGIs over 100k)
Charity contributions deductions: $4,248 (7% of AGI, reported on 22.1% of returns)
Here:
$4,248
State:
$4,305
Here:
6.7% of AGI
State:
5.0% of AGI
(% of AGI for various income ranges: 1.2% for AGIs $10k-25k, 2.2% for AGIs $25k-50k, 3.6% for AGIs $50k-75k, 4.5% for AGIs $75k-100k, 4.0% for AGIs over 100k)
Total tax: $3,719 (reported on 69.5% of returns)
29058:
$3,719
State:
$6,497
(% of AGI for various income ranges: 2.1% for AGIs below $10k, 3.6% for AGIs $10k-25k, 5.9% for AGIs $25k-50k, 8.3% for AGIs $50k-75k, 9.4% for AGIs $75k-100k, 16.9% for AGIs over 100k)
Earned income credit: $1,811 (reported on 25.4% of returns)
Here:
$1,811
State:
$1,882
Percentage of individuals using paid preparers for their 2004 taxes: 82.7%
Here:
83%
State:
66%
(% for various income ranges: 76.6% for AGIs below $10k, 83.4% for AGIs $10k-25k, 85.4% for AGIs $25k-50k, 84.0% for AGIs $50k-75k, 83.2% for AGIs $75k-100k, 79.2% for AGIs over 100k)
Household received Food Stamps/SNAP in the past 12 months: 201 Household did not receive Food Stamps/SNAP in the past 12 months: 1,780
Women who had a birth in the past 12 months: 92 (74 now married, 21 unmarried) Women who did not have a birth in the past 12 months: 1,308 (749 now married, 566 unmarried)
Housing units in zip code 29058 with a mortgage: 848 (44 second mortgage, 45 both second mortgage and home equity loan) Houses without a mortgage: 12
Median monthly owner costs for units with a mortgage: $1,322 Median monthly owner costs for units without a mortgage: $313
Residents with income below the poverty level in 2022:
This zip code:
13.1%
Whole state:
14.0%
Residents with income below 50% of the poverty level in 2022:
This zip code:
9.7%
Whole state:
7.3%
Median number of rooms in houses and condos:
Here:
5.8
State:
6.4
Median number of rooms in apartments:
Here:
5.6
State:
4.5
Notable locations in this zip code not listed on our city pages
Notable locations in zip code 29058: Warrens Old Muster Ground (A), Mount Carmel Camp Meeting Ground (B), Springs-Stevens State Fish Hatchery (C), Pleasant Hill Fire Department Station 13 (D), Heath Springs City Hall (E), Heath Springs Fire Department Station 9 (F), Pleasant Hill Fire Department Station 13 (G), Rich Hill Fire Department Station 15 (H). Display/hide their locations on the map
Churches in zip code 29058 include: Pleasant Grove Church (A), Salem United Methodist Church (B), Rich Hill Baptist Church (C), Pleasant Hill Church (D), Heath Springs Baptist Church (E), Oak Spring Church (F), New Hope Church (G), Mount Zion Church (H), Mount Carmel Church (I). Display/hide their locations on the map
Cemeteries: Rock Hill Cemetery (1), Hammond Cemetery (2), Duncan Cemetery (3), Summerville-Cunningham Cemetery (4), Mount Carmel Cemetery (5), Mobley Cemetery (6), Mackey Walker Cemetery (7). Display/hide their locations on the map
Streams, rivers, and creeks: Showerbath Branch (A), Rocky Creek (B), Mobley Branch (C), Lyles Branch (D), Little Lynches Creek (E), Childers Creek (F), Cedar Creek (G), Gar Creek (H), Blackman Branch (I). Display/hide their locations on the map
1,231 married couples with children.
100 single-parent households (11 men, 89 women).
98.9% of residents of 29058 zip code speak English at home.
0.4% of residents speak Spanish at home (29% very well, 71% not at all).
0.4% of residents speak other Indo-European language at home (100% well).
Foreign born population: 0 (0.0%)
:
0.0%
Whole state:
5.2%
15%American
10%Irish
8%English
6%Scotch-Irish
2%German
1%British
1%Welsh
Facilities with environmental interests located in this zip code:
AT&T HEATH SPRINGS (RD S29 34 3 MI W OF NEW HOPE R in HEATH SPRINGS, SC)
(Resource Conservation and Recovery Act (tracking hazardous waste)) STATE MASTER (South Carolina database) - HAZARDOUS WASTE PROGRAM Organizations: AT & T (CONTACT/OWNER)
Alternative names: AT&T - HEATH SPRINGS (DEACTIVATED)
DESIGNS AMERICANA (110A WEST CASTON in HEATH SPRINGS, SC)
(Resource Conservation and Recovery Act (tracking hazardous waste)) STATE MASTER (South Carolina database) - HAZARDOUS WASTE PROGRAM Organizations: JAN C SHORE (CONTACT/OWNER)
Alternative names: DESIGNA AMERICANA
DAVIS NEON INC (142 ROWLAND AVE in HEATH SPRINGS, SC)
AIR MINOR (AIRS/AFS) STATE MASTER (South Carolina database) - AIR PROGRAM, Business SIC classification: SIGNS AND ADVERTISING SPECIALTIES
CAROLINA QUARRIES/CONGAREE QUA (3587 TWITTY MILL ROAD in HEATH SPRINGS, SC)
National Pollutant Discharge Elimination System NON-MAJOR (Tracking pollutant discharge elimination systems) - permit Business SIC classification: DIMENSION STONE
DAVIS PLASTICS, LLC. (142 ROWLAND AVE. in HEATH SPRINGS, SC)
AIR MINOR (AIRS/AFS) Business SIC classification: SIGNS AND ADVERTISING SPECIALTIES
Housing units lacking complete plumbing facilities: 2.1% Housing units lacking complete kitchen facilities: 4.0%
46.1%Electricity
44.9%Utility gas
7.2%Bottled, tank, or LP gas
1.0%Wood
0.9%Other fuel
Population in 1990: 5,101.
Place of birth for U.S.-born residents:
This state: 4,193
Northeast: 350
Midwest: 80
South: 974
West: 100
75% of the 29058 zip code residents lived in the same house 5 years ago. Out of people who lived in different houses, 74% lived in this county. Out of people who lived in different counties, 50% lived in South Carolina.
88% of the 29058 zip code residents lived in the same house 1 year ago. Out of people who lived in different houses, 19% moved from this county. Out of people who lived in different houses, 30% moved from different county within same state. Out of people who lived in different houses, 58% moved from different state.
Private vs. public school enrollment:
Students in private schools in grades 1 to 8 (elementary and middle school): 29
Here:
4.3%
South Carolina:
14.4%
Students in private schools in grades 9 to 12 (high school): 4
Here:
1.0%
South Carolina:
11.1%
Students in private undergraduate colleges:
Here:
0.0%
South Carolina:
21.9%
Occupation by median earnings in the past 12 months ($)
87,951Business and financial operations occupations
83,780Law enforcement workers including supervisors
81,963Computer and mathematical occupations
81,656Health diagnosing and treating practitioners and other technical occupations
78,035Management occupations
67,929Installation, maintenance, and repair occupations
Companies with federal contracts located in this zip code:
CAROTRON INC (3204 ROCKY RIVER RD in HEATH SPRINGS, SC; small business)
$8,450 with Army for Miscellaneous Engine Accessories, Nonaircraft. Taking place in NC. Signed on 2004-09-08. Completion date: 2004-09-22.
Top industries in this zip code by the number of employees in 2005:
Other Services (except Public Administration): Religious Organizations (10-19 employees: 1 establishment, 5-9 employees: 3 establishments, 1-4 employees: 5 establishments)
Health Care and Social Assistance: Offices of Dentists (20-49: 1)
Health Care and Social Assistance: Homes for the Elderly (20-49: 1)
Construction: New Single-Family Housing Construction (except Operative Builders) (5-9: 2, 1-4: 2)
People in group quarters in 2000:
45 people in other noninstitutional group quarters
Fatal accident statistics in 2014:
Fatal accident count: 4
Vehicles involved in fatal accidents: 5
Fatal accidents caused by drunken drivers: 3
Fatalities: 4
Persons involved in fatal accidents: 8
Pedestrians involved in fatal accidents: 0
Fatal accident statistics in 2012:
Fatal accident count: 1
Vehicles involved in fatal accidents: 1
Fatal accidents caused by drunken drivers: 0
Fatalities: 1
Persons involved in fatal accidents: 1
Pedestrians involved in fatal accidents: 0
Home Mortgage Disclosure Act Aggregated Statistics For Year 2009 (Based on 2 partial tracts)
A) FHA, FSA/RHS & VA Home Purchase Loans
B) Conventional Home Purchase Loans
C) Refinancings
F) Non-occupant Loans on < 5 Family Dwellings (A B C & D)
G) Loans On Manufactured Home Dwelling (A B C & D)
Number
Average Value
Number
Average Value
Number
Average Value
Number
Average Value
Number
Average Value
LOANS ORIGINATED
1
$188,690
5
$178,056
27
$234,425
11
$266,088
1
$56,350
APPLICATIONS APPROVED, NOT ACCEPTED
0
$0
1
$216,550
2
$248,215
2
$216,240
0
$0
APPLICATIONS DENIED
0
$0
2
$96,245
7
$151,334
1
$265,630
2
$112,395
APPLICATIONS WITHDRAWN
0
$0
0
$0
3
$205,367
1
$168,430
0
$0
FILES CLOSED FOR INCOMPLETENESS
0
$0
0
$0
0
$0
0
$0
0
$0
Aggregated Statistics For Year 2008 (Based on 2 partial tracts)
A) FHA, FSA/RHS & VA Home Purchase Loans
B) Conventional Home Purchase Loans
C) Refinancings
D) Home Improvement Loans
F) Non-occupant Loans on < 5 Family Dwellings (A B C & D)
G) Loans On Manufactured Home Dwelling (A B C & D)
Number
Average Value
Number
Average Value
Number
Average Value
Number
Average Value
Number
Average Value
Number
Average Value
LOANS ORIGINATED
1
$137,090
6
$143,420
15
$183,417
2
$153,710
6
$228,163
3
$84,953
APPLICATIONS APPROVED, NOT ACCEPTED
0
$0
1
$63,320
1
$170,650
0
$0
1
$163,370
0
$0
APPLICATIONS DENIED
1
$93,080
2
$129,650
11
$181,325
1
$150,380
2
$190,275
1
$76,300
APPLICATIONS WITHDRAWN
0
$0
1
$131,070
5
$210,160
0
$0
1
$156,720
1
$93,080
FILES CLOSED FOR INCOMPLETENESS
0
$0
1
$106,060
1
$226,370
0
$0
0
$0
0
$0
Aggregated Statistics For Year 2007 (Based on 2 partial tracts)
B) Conventional Home Purchase Loans
C) Refinancings
D) Home Improvement Loans
F) Non-occupant Loans on < 5 Family Dwellings (A B C & D)
G) Loans On Manufactured Home Dwelling (A B C & D)
Number
Average Value
Number
Average Value
Number
Average Value
Number
Average Value
Number
Average Value
LOANS ORIGINATED
11
$224,786
15
$155,683
1
$79,470
10
$229,282
3
$115,243
APPLICATIONS APPROVED, NOT ACCEPTED
2
$178,405
2
$135,505
0
$0
2
$214,655
1
$115,560
APPLICATIONS DENIED
4
$316,918
11
$123,244
4
$100,680
2
$196,765
4
$81,445
APPLICATIONS WITHDRAWN
2
$225,420
4
$120,468
0
$0
1
$189,010
1
$37,990
FILES CLOSED FOR INCOMPLETENESS
1
$173,180
0
$0
0
$0
0
$0
0
$0
Aggregated Statistics For Year 2006 (Based on 2 partial tracts)
B) Conventional Home Purchase Loans
C) Refinancings
D) Home Improvement Loans
F) Non-occupant Loans on < 5 Family Dwellings (A B C & D)
G) Loans On Manufactured Home Dwelling (A B C & D)
Number
Average Value
Number
Average Value
Number
Average Value
Number
Average Value
Number
Average Value
LOANS ORIGINATED
15
$186,815
14
$169,834
3
$54,560
12
$226,765
4
$105,428
APPLICATIONS APPROVED, NOT ACCEPTED
2
$175,715
2
$110,495
0
$0
1
$278,290
0
$0
APPLICATIONS DENIED
3
$137,617
12
$104,425
3
$59,733
1
$88,650
3
$77,250
APPLICATIONS WITHDRAWN
1
$44,010
4
$116,192
0
$0
1
$76,930
0
$0
FILES CLOSED FOR INCOMPLETENESS
1
$66,490
2
$160,040
0
$0
0
$0
0
$0
Aggregated Statistics For Year 2005 (Based on 2 partial tracts)
A) FHA, FSA/RHS & VA Home Purchase Loans
B) Conventional Home Purchase Loans
C) Refinancings
D) Home Improvement Loans
F) Non-occupant Loans on < 5 Family Dwellings (A B C & D)
G) Loans On Manufactured Home Dwelling (A B C & D)
Number
Average Value
Number
Average Value
Number
Average Value
Number
Average Value
Number
Average Value
Number
Average Value
LOANS ORIGINATED
1
$109,230
9
$153,587
15
$148,549
1
$36,410
8
$179,988
4
$63,478
APPLICATIONS APPROVED, NOT ACCEPTED
0
$0
0
$0
2
$144,845
1
$37,360
1
$43,370
1
$37,040
APPLICATIONS DENIED
0
$0
4
$114,372
13
$108,983
3
$69,020
3
$111,020
3
$80,627
APPLICATIONS WITHDRAWN
0
$0
2
$89,125
5
$99,350
1
$105,430
1
$112,710
1
$64,900
FILES CLOSED FOR INCOMPLETENESS
0
$0
0
$0
2
$108,275
0
$0
0
$0
0
$0
Aggregated Statistics For Year 2004 (Based on 2 partial tracts)
B) Conventional Home Purchase Loans
C) Refinancings
D) Home Improvement Loans
F) Non-occupant Loans on < 5 Family Dwellings (A B C & D)
G) Loans On Manufactured Home Dwelling (A B C & D)
Detailed PMIC statistics for the following Tracts:9703.00
2002 - 2018 National Fire Incident Reporting System (NFIRS) incidents
According to the data from the years 2002 - 2018 the average number of fires per year is 52. The highest number of fire incidents - 82 took place in 2005, and the least - 4 in 2003. The data has a rising trend.
When looking into fire subcategories, the most reports belonged to: Outside Fires (45.3%), and Structure Fires (41.7%).
Fire incident types reported to NFIRS in Zip Code 29058


 Nearest zip codes: 29074, 29055, 29175, 29720, 29067, 29714.


 According to the data from the years 2002 - 2018 the average number of fires per year is 52. The highest number of fire incidents - 82 took place in 2005, and the least - 4 in 2003. The data has a rising trend.
 When looking into fire subcategories, the most reports belonged to: Outside Fires (45.3%), and Structure Fires (41.7%).