Estimated zip code population in 2022: 2,618 Zip code population in 2010: 2,206 Zip code population in 2000: 2,336
Houses and condos: 1,064 Renter-occupied apartments: 190
% of renters here:
19%
State:
29%
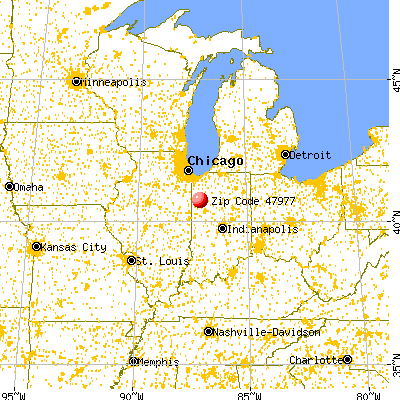
March 2022 cost of living index in zip code 47977: 85.1 (less than average, U.S. average is 100)
Land area: 83.5 sq. mi. Water area: 0.1 sq. mi.
Population density: 31 people per square mile
(very low).
OSM Map
General Map
Google Map
MSN Map
OSM Map
General Map
Google Map
MSN Map
OSM Map
General Map
Google Map
MSN Map
OSM Map
General Map
Google Map
MSN Map
Please wait while loading the map...
Real estate property taxes paid for housing units in 2022:
This zip code:
0.4% ($732)
Indiana:
0.7% ($1,467)
Median real estate property taxes paid for housing units with mortgages in 2022: $678 (0.4%) Median real estate property taxes paid for housing units with no mortgage in 2022: $842 (0.5%)
Business Search- 14 Million verified businesses
Males: 1,477
(56.4%)
Females: 1,141
(43.6%)
For population 25 years and over in 47977:
High school or higher: 93.7%
Bachelor's degree or higher: 27.2%
Graduate or professional degree: 11.4%
Unemployed: 1.5%
Mean travel time to work (commute): 23.3 minutes
For population 15 years and over in 47977:
Never married: 21.2%
Now married: 61.1%
Separated: 0.3%
Widowed: 5.7%
Divorced: 11.8%
Zip code 47977 compared to state average:
Unemployed percentage below state average.
Black race population percentage below state average.
Hispanic race population percentage below state average.
Median age above state average.
Foreign-born population percentage significantly below state average.
Renting percentage below state average.
Length of stay since moving in significantly above state average.
Estimated median house/condo value in 2022: $180,055
47977:
$180,055
Indiana:
$208,700
Median resident age:
This zip code:
45.4 years
Indiana median age:
38.2 years
Average household size:
This zip code:
2.6 people
Indiana:
2.4 people
Averages for the 2020 tax year for zip code 47977, filed in 2021:
Average Adjusted Gross Income (AGI) in 2020: $66,065 (Individual Income Tax Returns)
Here:
$66,065
State:
$64,978
Salary/wage: $48,990 (reported on 85.2% of returns)
Here:
$48,990
State:
$55,245
(% of AGI for various income ranges: 1293.5% for AGIs below $25k, 4180.0% for AGIs $25k-50k, 7250.0% for AGIs $50k-75k, 9082.2% for AGIs $75k-100k, 17688.6% for AGIs $100k-200k)
Taxable interest for individuals: $3,350 (reported on 31.5% of returns)
This zip code:
$3,350
Indiana:
$1,351
(% of AGI for various income ranges: 33.0% for AGIs below $25k, 30.0% for AGIs $25k-50k, 23.8% for AGIs $50k-75k, 151.1% for AGIs $75k-100k, 187.1% for AGIs $100k-200k)
Ordinary dividends: $4,247 (reported on 17.6% of returns)
Here:
$4,247
State:
$5,827
(% of AGI for various income ranges: 19.1% for AGIs below $25k, 52.8% for AGIs $25k-50k, 30.8% for AGIs $50k-75k, 64.4% for AGIs $75k-100k, 814.3% for AGIs $100k-200k)
Net capital gain/loss in AGI: +$20,047 (reported on 13.9% of returns)
Here:
+$20,047
State:
+$17,730
(% of AGI for various income ranges: 5.2% for AGIs below $25k, 29.4% for AGIs $25k-50k, 33.8% for AGIs $50k-75k, 21.1% for AGIs $75k-100k, 375.7% for AGIs $100k-200k)
Profit/loss from business: +$9,536 (reported on 13.0% of returns)
Here:
+$9,536
State:
+$12,144
(% of AGI for various income ranges: 95.7% for AGIs below $25k, 91.7% for AGIs $25k-50k, 216.9% for AGIs $50k-75k, 126.7% for AGIs $75k-100k, 791.4% for AGIs $100k-200k)
Taxable individual retirement arrangement distribution: $12,330 (reported on 9.3% of returns)
47977:
$12,330
Indiana:
$18,302
(% of AGI for various income ranges: 76.1% for AGIs below $25k, 86.1% for AGIs $25k-50k, 303.8% for AGIs $50k-75k, 725.7% for AGIs $100k-200k)
Total itemized deductions: $58,425 (reported on 3.7% of returns)
Here:
$58,425
State:
$35,601
(% of AGI for various income ranges: 3338.6% for AGIs $100k-200k)
Charity contributions: $26,833 (reported on 2.8% of returns)
Here:
$26,833
State:
$15,596
(% of AGI for various income ranges: 1150.0% for AGIs $100k-200k)
Taxes paid: $7,475 (reported on 3.7% of returns)
47977:
$7,475
State:
$7,542
(% of AGI for various income ranges: 427.1% for AGIs $100k-200k)
Earned income credit: $2,441 (reported on 15.7% of returns)
Here:
$2,441
State:
$2,298
(% of AGI for various income ranges: 112.6% for AGIs below $25k, 86.7% for AGIs $25k-50k)
Percentage of individuals using paid preparers for their 2020 taxes: 97.2%
Here:
97%
State:
94%
(% for various income ranges: 94.3% for AGIs below $25k, 100.0% for AGIs $25k-50k, 94.7% for AGIs $50k-75k, 100.0% for AGIs $75k-100k, 100.0% for AGIs $100k-200k, 100.0% for AGIs over 200k)
Averages for the 2012 tax year for zip code 47977, filed in 2013:
Average Adjusted Gross Income (AGI) in 2012: $63,917 (Individual Income Tax Returns)
Here:
$63,917
State:
$52,932
Salary/wage: $38,115 (reported on 85.7% of returns)
Here:
$38,115
State:
$45,173
(% of AGI for various income ranges: 79.6% for AGIs below $25k, 81.4% for AGIs $25k-50k, 78.4% for AGIs $50k-75k, 72.2% for AGIs $75k-100k, 61.3% for AGIs $100k-200k, 13.8% for AGIs over 200k)
Taxable interest for individuals: $1,800 (reported on 30.4% of returns)
This zip code:
$1,800
Indiana:
$1,311
(% of AGI for various income ranges: 1.9% for AGIs below $25k, 0.9% for AGIs $25k-50k, 0.8% for AGIs $50k-75k, 0.5% for AGIs $75k-100k, 0.9% for AGIs $100k-200k, 0.8% for AGIs over 200k)
Ordinary dividends: $4,325 (reported on 17.9% of returns)
Here:
$4,325
State:
$4,690
(% of AGI for various income ranges: 1.2% for AGIs below $25k, 0.7% for AGIs $25k-50k, 0.3% for AGIs $50k-75k, 0.5% for AGIs $75k-100k, 0.5% for AGIs $100k-200k, 2.2% for AGIs over 200k)
Net capital gain/loss in AGI: +$24,029 (reported on 12.5% of returns)
Here:
+$24,029
State:
+$10,406
(% of AGI for various income ranges: 1.0% for AGIs $75k-100k, 4.2% for AGIs $100k-200k, 10.4% for AGIs over 200k)
Profit/loss from business: +$7,918 (reported on 15.2% of returns)
Here:
+$7,918
State:
+$11,105
(% of AGI for various income ranges: 4.6% for AGIs below $25k, 3.4% for AGIs $25k-50k, 3.0% for AGIs $50k-75k, 0.5% for AGIs $75k-100k, 4.1% for AGIs $100k-200k)
Taxable individual retirement arrangement distribution: $10,180 (reported on 8.9% of returns)
47977:
$10,180
Indiana:
$13,841
(% of AGI for various income ranges: 2.4% for AGIs below $25k, 2.3% for AGIs $25k-50k, 4.6% for AGIs $50k-75k, 2.4% for AGIs $100k-200k)
Total itemized deductions: $22,204 (14% of AGI, reported on 22.3% of returns)
Here:
$22,204
State:
$20,913
Here:
13.9% of AGI
State:
18.2% of AGI
(% of AGI for various income ranges: 6.4% for AGIs below $25k, 7.4% for AGIs $25k-50k, 8.1% for AGIs $50k-75k, 10.5% for AGIs $75k-100k, 9.9% for AGIs $100k-200k, 6.2% for AGIs over 200k)
Charity contributions: $6,689 (reported on 17.0% of returns)
Here:
$6,689
State:
$4,697
(% of AGI for various income ranges: 1.0% for AGIs $25k-50k, 1.3% for AGIs $50k-75k, 2.1% for AGIs $75k-100k, 1.3% for AGIs $100k-200k, 2.6% for AGIs over 200k)
Taxes paid: $8,944 (reported on 22.3% of returns)
47977:
$8,944
State:
$7,456
(% of AGI for various income ranges: 0.9% for AGIs below $25k, 1.3% for AGIs $25k-50k, 3.0% for AGIs $50k-75k, 4.2% for AGIs $75k-100k, 4.2% for AGIs $100k-200k, 3.5% for AGIs over 200k)
Earned income credit: $2,200 (reported on 17.0% of returns)
Here:
$2,200
State:
$2,265
(% of AGI for various income ranges: 5.8% for AGIs below $25k, 1.2% for AGIs $25k-50k)
Percentage of individuals using paid preparers for their 2012 taxes: 61.6%
Here:
62%
State:
53%
(% for various income ranges: 52.2% for AGIs below $25k, 64.3% for AGIs $25k-50k, 71.4% for AGIs $50k-75k, 63.6% for AGIs $75k-100k, 66.7% for AGIs $100k-200k, 100.0% for AGIs over 200k)
Averages for the 2004 tax year for zip code 47977, filed in 2005:
Average Adjusted Gross Income (AGI) in 2004: $35,399 (Individual Income Tax Returns)
Here:
$35,399
State:
$44,790
Salary/wage: $31,978 (reported on 84.3% of returns)
Here:
$31,978
State:
$39,615
(% of AGI for various income ranges: 111.1% for AGIs below $10k, 75.2% for AGIs $10k-25k, 81.5% for AGIs $25k-50k, 81.9% for AGIs $50k-75k, 83.5% for AGIs $75k-100k, 46.4% for AGIs over 100k)
Taxable interest for individuals: $1,961 (reported on 43.9% of returns)
This zip code:
$1,961
Indiana:
$1,535
(% of AGI for various income ranges: 11.3% for AGIs below $10k, 4.0% for AGIs $10k-25k, 2.3% for AGIs $25k-50k, 1.6% for AGIs $50k-75k, 1.0% for AGIs $75k-100k, 3.1% for AGIs over 100k)
Taxable dividends: $1,918 (reported on 18.4% of returns)
Here:
$1,918
State:
$2,998
(% of AGI for various income ranges: 2.2% for AGIs below $10k, 1.5% for AGIs $10k-25k, 0.5% for AGIs $25k-50k, 1.2% for AGIs $50k-75k, 0.2% for AGIs $75k-100k, 1.7% for AGIs over 100k)
Net capital gain/loss: +$5,527 (reported on 16.4% of returns)
Here:
+$5,527
State:
+$8,619
(% of AGI for various income ranges: -1.9% for AGIs below $10k, -0.3% for AGIs $10k-25k, 0.9% for AGIs $25k-50k, 0.6% for AGIs $50k-75k, 0.8% for AGIs $75k-100k, 13.2% for AGIs over 100k)
Profit/loss from business: +$7,708 (reported on 16.5% of returns)
Here:
+$7,708
State:
+$10,071
(% of AGI for various income ranges: 13.5% for AGIs below $10k, 3.4% for AGIs $10k-25k, 2.6% for AGIs $25k-50k, 3.1% for AGIs $50k-75k, -0.1% for AGIs $75k-100k, 8.5% for AGIs over 100k)
Profit/loss from farming: +$6,077 (reported on 7.0% of returns)
Here:
+$6,077
State:
-$2,212
(% of AGI for various income ranges: -1.5% for AGIs below $10k, 0.1% for AGIs $25k-50k, 3.0% for AGIs $50k-75k, 2.5% for AGIs $75k-100k)
IRA payment deduction: $2,714 (reported on 2.5% of returns)
47977:
$2,714
Indiana:
$2,840
Self-employed pension: $7,417 (reported on 1.1% of returns)
Here:
$7,417
Indiana:
$15,305
Total itemized deductions: $13,621 (22% of AGI, reported on 23.5% of returns)
Here:
$13,621
State:
$17,065
Here:
21.8% of AGI
State:
19.5% of AGI
(% of AGI for various income ranges: 11.7% for AGIs below $10k, 9.3% for AGIs $10k-25k, 7.6% for AGIs $25k-50k, 9.6% for AGIs $50k-75k, 9.1% for AGIs $75k-100k, 10.1% for AGIs over 100k)
Charity contributions deductions: $3,510 (5% of AGI, reported on 17.8% of returns)
Here:
$3,510
State:
$3,550
Here:
5.1% of AGI
State:
3.8% of AGI
(% of AGI for various income ranges: 1.9% for AGIs $10k-25k, 1.2% for AGIs $25k-50k, 1.6% for AGIs $50k-75k, 1.7% for AGIs $75k-100k, 3.3% for AGIs over 100k)
Total tax: $4,435 (reported on 74.5% of returns)
47977:
$4,435
State:
$6,914
(% of AGI for various income ranges: 4.4% for AGIs below $10k, 4.2% for AGIs $10k-25k, 6.5% for AGIs $25k-50k, 8.8% for AGIs $50k-75k, 11.2% for AGIs $75k-100k, 17.9% for AGIs over 100k)
Earned income credit: $1,667 (reported on 14.2% of returns)
Here:
$1,667
State:
$1,685
Percentage of individuals using paid preparers for their 2004 taxes: 67.4%
Here:
67%
State:
59%
(% for various income ranges: 54.7% for AGIs below $10k, 71.9% for AGIs $10k-25k, 72.0% for AGIs $25k-50k, 68.8% for AGIs $50k-75k, 66.2% for AGIs $75k-100k, 79.5% for AGIs over 100k)
Household received Food Stamps/SNAP in the past 12 months: 35 Household did not receive Food Stamps/SNAP in the past 12 months: 967
Women who had a birth in the past 12 months: 22 (12 now married, 9 unmarried) Women who did not have a birth in the past 12 months: 498 (268 now married, 230 unmarried)
Housing units in zip code 47977 with a mortgage: 409 (37 second mortgage, 29 both second mortgage and home equity loan) Houses without a mortgage: 31
Median monthly owner costs for units with a mortgage: $1,107 Median monthly owner costs for units without a mortgage: $490
Residents with income below the poverty level in 2022:
This zip code:
6.9%
Whole state:
12.6%
Residents with income below 50% of the poverty level in 2022:
This zip code:
2.1%
Whole state:
6.3%
Median number of rooms in houses and condos:
Here:
6.4
State:
6.6
Median number of rooms in apartments:
Here:
6.0
State:
4.3
Notable locations in this zip code not listed on our city pages
Size of family households: 351 2-persons, 200 3-persons, 113 4-persons, 58 5-persons, 5 6-persons, 12 7-or-more-persons
Size of nonfamily households: 234 1-person, 28 2-persons
383 married couples with children.
120 single-parent households (34 men, 86 women).
96.9% of residents of 47977 zip code speak English at home.
1.3% of residents speak Spanish at home (55% very well, 45% well).
1.1% of residents speak other Indo-European language at home (67% very well, 33% not well).
Foreign born population: 27 (1.0%) (41.2% of them are naturalized citizens)
This zip code:
1.0%
Whole state:
6.1%
48%Dominica
30%Chile
26%Honduras
7%Japan
7%Bolivia
31%German
16%American
14%English
13%Irish
7%French
4%Polish
1%European
Year of entry for the foreign-born population
182010 or later
102000 to 2009
21990 to 1999
3Before 1990
Facilities with environmental interests located in this zip code:
MONSANTO SEED (15849 S US 231 in REMINGTON, IN)
AIR MAJOR (AIRS/AFS) STATE MASTER (Indiana facility tracking) - ACES-OP-07300018, AIR PROGRAM, CRTK-10521, EPCRA, LUST-198907114, LEAKING STORAGE TANK, LUST-198907525, UST-1476, UNDERGROUND STORAGE TANK PROGRAM CRITERIA AND HAZARDOUS AIR POLLUTANT INVENTORY (Inventory of air pollution sources) (Resource Conservation and Recovery Act (tracking hazardous waste)) Conditionally Exempt Small Quantity Generators, less than 100 kg/month of hazardous waste (Resource Conservation and Recovery Act (tracking hazardous waste)) Business SIC classification: FOOD PREPARATIONS; GRAIN AND FIELD BEANS Business NAICS classification: POSTHARVEST CROP ACTIVITIES (EXCEPT COTTON GINNING). Organizations: DEKALB PLANT GENETICS (CONTACT/OWNER)
Alternative names: DEKALB GENETICS CORPORATION, DEKALB PLANT GENETICS
SCHILLI LEASING (6358 US 24 W in REMINGTON, IN)
STATE MASTER (Indiana facility tracking) - CRTK-8403, EPCRA, LUST-199111538, LEAKING STORAGE TANK, LUST-199811505, UST-501, UNDERGROUND STORAGE TANK PROGRAM TRANSPORTER (Resource Conservation and Recovery Act (tracking hazardous waste)) Conditionally Exempt Small Quantity Generators, less than 100 kg/month of hazardous waste (Resource Conservation and Recovery Act (tracking hazardous waste)) - notification Organizations: THOMAS R SCHILLI (CONTACT/OWNER)
, SCHILLI MOTOR LINES INC (CONTACT/OWNER)
Alternative names: BAILEY TRANSPORT INC, SCHILLI LEASING INC, SCHILLI MOTOR LINES INC, SCHILLI MOTOR LINES INC
REMINGTON FREIGHT LINES (6502 W US 24 in REMINGTON, IN)
STATE MASTER (Indiana facility tracking) - CRTK-961, EPCRA, LUST-199902541, LEAKING STORAGE TANK, UST-12419, UNDERGROUND STORAGE TANK PROGRAM, UST-21341, (Resource Conservation and Recovery Act (tracking hazardous waste)) Organizations: J M L RENTALS (CONTACT/OWNER)
REMINGTON WWTP (16197 S 630 W in REMINGTON, IN)
STATE MASTER (Indiana facility tracking) - CRTK-1518, EPCRA National Pollutant Discharge Elimination System NON-MAJOR (Tracking pollutant discharge elimination systems) - permit Business SIC classification: SEWERAGE SYSTEMS Organizations: MARVIN K SUTTER (CONTACT/OPERATOR)
, TOWN COUNCIL PRESIDENT (CONTACT/OWNER)
Alternative names: REMINGTON MUNICIPAL STP
GRACE W R AND CO (HWY 24 E in REMINGTON, IN)
STATE MASTER (Indiana facility tracking) (Resource Conservation and Recovery Act (tracking hazardous waste))
REMINGTON CLEANERS (27 RAILROAD ST in REMINGTON, IN)
STATE MASTER (Indiana facility tracking) (Resource Conservation and Recovery Act (tracking hazardous waste))
OMNI FORGE INC (18325 S 580 W in REMINGTON, IN)
STATE MASTER (Indiana facility tracking) Conditionally Exempt Small Quantity Generators, less than 100 kg/month of hazardous waste (Resource Conservation and Recovery Act (tracking hazardous waste)) - notification TRI REPORTER (Tracking of toxic chemicals releasing facilities) Business SIC classification: IRON AND STEEL FORGINGS Alternative names: OMNI FORGE INC.
GREAT LAKES BULK SERVICE INC (HWY 24 W in REMINGTON, IN)
STATE MASTER (Indiana facility tracking) TRANSPORTER (Resource Conservation and Recovery Act (tracking hazardous waste))
NAPA REMINGTON (US 24 W PO BOX 342 in REMINGTON, IN)
STATE MASTER (Indiana facility tracking) Conditionally Exempt Small Quantity Generators, less than 100 kg/month of hazardous waste (Resource Conservation and Recovery Act (tracking hazardous waste)) - notification Organizations: NAPA REMINGTON INC (CONTACT/OWNER)
CENTRAL SOYA COMPANY INCORPORATED (410 CRESSY AVENUE in REMINGTON, IN)
STATE MASTER (Indiana facility tracking) TRI REPORTER (Tracking of toxic chemicals releasing facilities) Business SIC classification: FOOD PREPARATIONS
BOOM CITY FIREWORKS (5883 W. 1400 SOUTH in REMINGTON, IN)
ENFORCEMENT/COMPLIANCE ACTIVITY (Integrated Compliance Information System)
CLARK AGRI SERVICES (RR 1 BOX 240 in REMINGTON, IL)
COMPLIANCE ACTIVITY (Tracking inspections of insecticide, fungicide, and rodenticide, and toxic substances)
Housing units lacking complete plumbing facilities: 0.5% Housing units lacking complete kitchen facilities: 0.6%
61.0%Utility gas
21.2%Bottled, tank, or LP gas
17.0%Electricity
1.0%Fuel oil, kerosene, etc.
Population in 1990: 1,937. Population change in the 1990s: +399 (+20.6%).
Place of birth for U.S.-born residents:
This state: 1,974
Northeast: 4
Midwest: 386
South: 155
West: 49
64% of the 47977 zip code residents lived in the same house 5 years ago. Out of people who lived in different houses, 50% lived in this county. Out of people who lived in different counties, 50% lived in Indiana.
94% of the 47977 zip code residents lived in the same house 1 year ago. Out of people who lived in different houses, 33% moved from this county. Out of people who lived in different houses, 23% moved from different county within same state. Out of people who lived in different houses, 51% moved from different state.
Private vs. public school enrollment:
Students in private schools in grades 1 to 8 (elementary and middle school): 78
Here:
29.7%
Indiana:
14.9%
Students in private schools in grades 9 to 12 (high school): 30
Here:
35.3%
Indiana:
11.4%
Students in private undergraduate colleges: 1
Here:
2.4%
Indiana:
22.3%
Occupation by median earnings in the past 12 months ($)
80,046Management occupations
62,118Transportation occupations
55,317Construction and extraction occupations
55,006Sales and related occupations
54,648Installation, maintenance, and repair occupations
54,257Computer and mathematical occupations
Top industries in this zip code by the number of employees in 2005:
Construction: Commercial and Institutional Building Construction (250-499 employees: 1 establishment, 1-4 employees: 1 establishment)
Administrative and Support and Waste Management and Remediation Services: Office Administrative Services (100-249: 1)
Management of Companies and Enterprises: Corporate, Subsidiary, and Regional Managing Offices (100-249: 1)
Accommodation and Food Services: Limited-Service Restaurants (20-49: 2, 10-19: 1)
Real Estate and Rental and Leasing: Truck, Utility Trailer, and RV (Recreational Vehicle) Rental and Leasing (50-99: 1)
Fatal accident statistics in 2013:
Fatal accident count: 4
Vehicles involved in fatal accidents: 5
Fatal accidents caused by drunken drivers: 0
Fatalities: 4
Persons involved in fatal accidents: 10
Pedestrians involved in fatal accidents: 0
Fatal accident statistics in 2012:
Fatal accident count: 1
Vehicles involved in fatal accidents: 1
Fatal accidents caused by drunken drivers: 1
Fatalities: 1
Persons involved in fatal accidents: 1
Pedestrians involved in fatal accidents: 0
Home Mortgage Disclosure Act Aggregated Statistics For Year 2009 (Based on 2 partial tracts)
A) FHA, FSA/RHS & VA Home Purchase Loans
B) Conventional Home Purchase Loans
C) Refinancings
D) Home Improvement Loans
F) Non-occupant Loans on < 5 Family Dwellings (A B C & D)
G) Loans On Manufactured Home Dwelling (A B C & D)
Number
Average Value
Number
Average Value
Number
Average Value
Number
Average Value
Number
Average Value
Number
Average Value
LOANS ORIGINATED
9
$82,306
7
$94,374
49
$108,357
5
$19,458
2
$48,240
2
$62,545
APPLICATIONS APPROVED, NOT ACCEPTED
0
$0
0
$0
4
$135,312
1
$4,090
0
$0
0
$0
APPLICATIONS DENIED
1
$45,790
3
$67,860
23
$143,116
2
$132,040
1
$32,700
0
$0
APPLICATIONS WITHDRAWN
1
$94,840
2
$129,180
7
$89,119
2
$16,350
0
$0
0
$0
FILES CLOSED FOR INCOMPLETENESS
1
$63,770
0
$0
0
$0
0
$0
0
$0
0
$0
Aggregated Statistics For Year 2008 (Based on 2 partial tracts)
A) FHA, FSA/RHS & VA Home Purchase Loans
B) Conventional Home Purchase Loans
C) Refinancings
D) Home Improvement Loans
F) Non-occupant Loans on < 5 Family Dwellings (A B C & D)
G) Loans On Manufactured Home Dwelling (A B C & D)
Number
Average Value
Number
Average Value
Number
Average Value
Number
Average Value
Number
Average Value
Number
Average Value
LOANS ORIGINATED
5
$81,760
11
$72,172
21
$125,404
5
$60,176
3
$78,217
4
$106,698
APPLICATIONS APPROVED, NOT ACCEPTED
0
$0
2
$150,845
3
$165,427
0
$0
0
$0
0
$0
APPLICATIONS DENIED
0
$0
2
$102,200
24
$108,298
5
$44,478
0
$0
1
$112,010
APPLICATIONS WITHDRAWN
0
$0
2
$188,050
10
$99,502
0
$0
0
$0
1
$80,940
FILES CLOSED FOR INCOMPLETENESS
0
$0
0
$0
0
$0
0
$0
0
$0
0
$0
Aggregated Statistics For Year 2007 (Based on 2 partial tracts)
A) FHA, FSA/RHS & VA Home Purchase Loans
B) Conventional Home Purchase Loans
C) Refinancings
D) Home Improvement Loans
F) Non-occupant Loans on < 5 Family Dwellings (A B C & D)
G) Loans On Manufactured Home Dwelling (A B C & D)
Number
Average Value
Number
Average Value
Number
Average Value
Number
Average Value
Number
Average Value
Number
Average Value
LOANS ORIGINATED
2
$114,055
34
$116,388
29
$95,547
3
$53,960
6
$193,362
6
$216,937
APPLICATIONS APPROVED, NOT ACCEPTED
0
$0
4
$90,550
6
$61,183
2
$94,435
2
$34,750
1
$115,280
APPLICATIONS DENIED
1
$32,700
6
$110,922
13
$131,759
5
$23,384
2
$108,330
1
$76,850
APPLICATIONS WITHDRAWN
1
$134,900
2
$131,635
11
$104,802
2
$92,800
0
$0
0
$0
FILES CLOSED FOR INCOMPLETENESS
0
$0
0
$0
4
$97,295
0
$0
1
$35,160
0
$0
Aggregated Statistics For Year 2006 (Based on 2 partial tracts)
A) FHA, FSA/RHS & VA Home Purchase Loans
B) Conventional Home Purchase Loans
C) Refinancings
D) Home Improvement Loans
F) Non-occupant Loans on < 5 Family Dwellings (A B C & D)
G) Loans On Manufactured Home Dwelling (A B C & D)
Number
Average Value
Number
Average Value
Number
Average Value
Number
Average Value
Number
Average Value
Number
Average Value
LOANS ORIGINATED
3
$110,377
40
$89,875
40
$112,870
6
$48,375
6
$67,860
3
$52,870
APPLICATIONS APPROVED, NOT ACCEPTED
0
$0
4
$78,898
2
$112,010
1
$18,800
0
$0
0
$0
APPLICATIONS DENIED
1
$53,960
7
$78,373
26
$98,647
3
$26,437
2
$48,240
0
$0
APPLICATIONS WITHDRAWN
0
$0
5
$65,736
14
$119,253
1
$22,080
2
$45,375
0
$0
FILES CLOSED FOR INCOMPLETENESS
0
$0
0
$0
5
$95,168
1
$24,530
0
$0
0
$0
Aggregated Statistics For Year 2005 (Based on 2 partial tracts)
A) FHA, FSA/RHS & VA Home Purchase Loans
B) Conventional Home Purchase Loans
C) Refinancings
D) Home Improvement Loans
F) Non-occupant Loans on < 5 Family Dwellings (A B C & D)
G) Loans On Manufactured Home Dwelling (A B C & D)
Number
Average Value
Number
Average Value
Number
Average Value
Number
Average Value
Number
Average Value
Number
Average Value
LOANS ORIGINATED
1
$89,940
23
$89,758
32
$78,234
3
$44,697
2
$60,500
2
$85,030
APPLICATIONS APPROVED, NOT ACCEPTED
1
$62,960
2
$39,655
5
$75,382
0
$0
1
$21,260
0
$0
APPLICATIONS DENIED
0
$0
4
$79,102
17
$88,589
4
$58,662
1
$49,060
0
$0
APPLICATIONS WITHDRAWN
0
$0
3
$128,637
16
$88,608
2
$509,775
2
$109,560
0
$0
FILES CLOSED FOR INCOMPLETENESS
0
$0
0
$0
4
$76,650
2
$37,610
0
$0
0
$0
Aggregated Statistics For Year 2004 (Based on 2 partial tracts)
A) FHA, FSA/RHS & VA Home Purchase Loans
B) Conventional Home Purchase Loans
C) Refinancings
D) Home Improvement Loans
F) Non-occupant Loans on < 5 Family Dwellings (A B C & D)
G) Loans On Manufactured Home Dwelling (A B C & D)
Detailed PMIC statistics for the following Tracts:9913.00
2002 - 2017 National Fire Incident Reporting System (NFIRS) incidents
According to the data from the years 2002 - 2017 the average number of fires per year is 22. The highest number of fires - 55 took place in 2007, and the least - 2 in 2014. The data has a dropping trend.
When looking into fire subcategories, the most reports belonged to: Structure Fires (33.7%), and Outside Fires (33.7%).
Fire incident types reported to NFIRS in Zip Code 47977


+$6,077
-$2,212
(% of AGI for various income ranges: -1.5% for AGIs below $10k, 0.1% for AGIs $25k-50k, 3.0% for AGIs $50k-75k, 2.5% for AGIs $75k-100k) Nearest zip codes: 47948, 47995, 47944, 47922, 47971, 47978.


 According to the data from the years 2002 - 2017 the average number of fires per year is 22. The highest number of fires - 55 took place in 2007, and the least - 2 in 2014. The data has a dropping trend.
 When looking into fire subcategories, the most reports belonged to: Structure Fires (33.7%), and Outside Fires (33.7%).