Jennings: Fire Incidents, Louisiana (LA)
Where are fire incidents reported in Jennings, LA
Something went wrong! Please refresh the page.
|
| |||||||||||||||||||||||||||||||||||||||||||||||||||||||||||||||||||||||||||||||||||||||||||||||||||||||||||||
| Other | 580 | |||||||||||||||||||||||||||||||||||||||||||||||||||||||||||||||||||||||||||||||||||||||||||||||||||||||||||||
2003 - 2018 National Fire Incident Reporting System (NFIRS) incidents
- Incident types reported to NFIRS in Jennings, LA
- 1,36245.9%Fire
- 1,04835.3%Hazardous Condition
- 2929.8%False Alarm
- 953.2%Rescue & EMS
- 903.0%Service Call
- 692.3%Good Intent Call
- 50.2%Overpressure Rupture
- 50.2%Special Incident
- 40.1%Severe Weather
- Fire incident types reported to NFIRS in Jennings, LA
- 58442.9%Structure Fires
- 35826.3%Outside Fires
- 23517.3%Mobile Property/Vehicle Fires
- 18513.6%Other
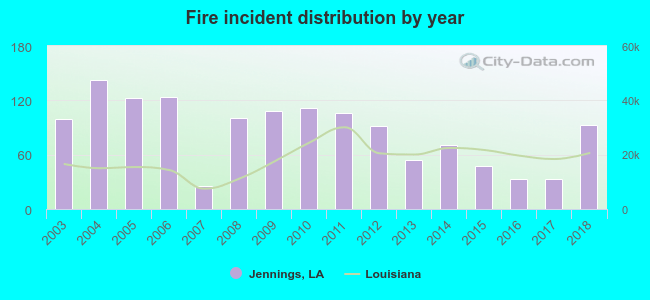 According to the data from the years 2003 - 2018 the average number of fires per year is 85. The highest number of reported fire incidents - 143 took place in 2004, and the least - 25 in 2007. The data has a decreasing trend.
The average number of yearly fire incidents per 10k residents in Jennings, LA compared to nearest cities:
(Note: Based on data for the last 3 years, including only cities with population 5,000 and above)
| Jennings: | 52.0 |
| Crowley: | 64.4 |
| Rayne: | 54.3 |
| Eunice: | 91.6 |
| Lake Charles: | 21.9 |
| Moss Bluff: | 61.7 |
| Scott: | 94.7 |
| Abbeville: | 97.2 |
| Carencro: | 113.6 |
 The median response time based on all reported fire incidents is 9 minutes. This is higher than the Louisiana median value.
The median response time in Jennings, LA compared to nearest cities:
(Note: Based on data for all years, including only cities with at least 500 fire incidents)
| Jennings: | 9 minutes |
| Crowley: | 3 minutes |
| Rayne: | 6 minutes |
| Eunice: | 4 minutes |
| Kaplan: | 6 minutes |
| Duson: | 8 minutes |
| Church Point: | 7 minutes |
| Lake Charles: | 8 minutes |
| Moss Bluff: | 8 minutes |
 30.2% incidents where reported in the morning and 69.8% in the evening. The most fires (16.2%) took place on Monday, and the least (12.6%) on Friday.
 Based on the 1,362 reports from years 2003 - 2018 most fires (9.8%) took place during March, and the least (5.9%) in February.
 Out of all 2,970 cases reported during the years 2003 - 2018, the most belonged to the categories: Fire (45.9%), Hazardous Condition (35.3%), and False Alarm (9.8%).
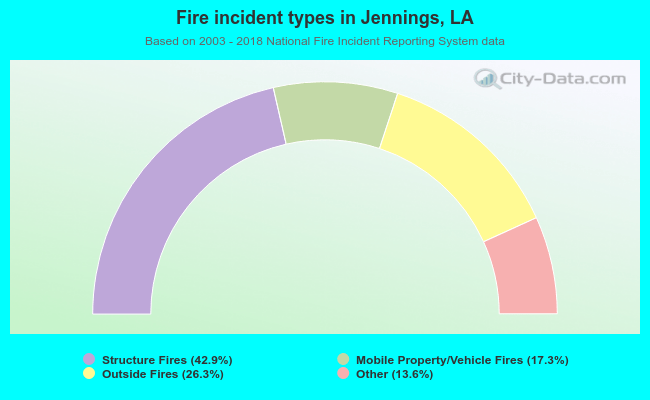 When looking into fire subcategories, the most reports belonged to: Structure Fires (42.9%), and Outside Fires (26.3%).