Maryville: Fire Incidents, Illinois (IL)
Where are fire incidents reported in Maryville, IL
Something went wrong! Please refresh the page.
|
| |||||||||||||||||||||||||||||||||||||||||||||||||||||||||||||||||||||||||||||||||||||||||||||||||||||||||||||
2002 - 2017 National Fire Incident Reporting System (NFIRS) incidents
- Incident types reported to NFIRS in Maryville, IL
- 25127.7%Rescue & EMS
- 20322.4%Fire
- 16117.8%Service Call
- 11712.9%Good Intent Call
- 9610.6%False Alarm
- 727.9%Hazardous Condition
- 30.3%Overpressure Rupture
- 30.3%Special Incident
- 10.1%Severe Weather
- Fire incident types reported to NFIRS in Maryville, IL
- 9747.8%Structure Fires
- 5527.1%Outside Fires
- 2813.8%Other
- 2311.3%Mobile Property/Vehicle Fires
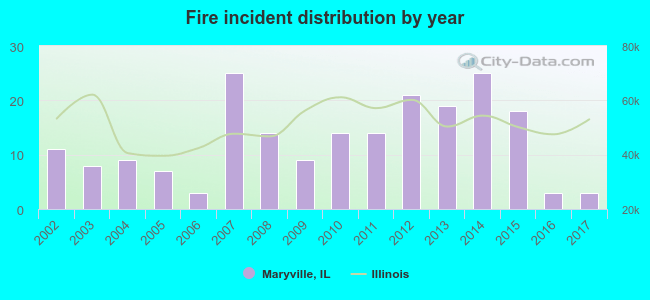 Based on the data from the years 2002 - 2017 the average number of fire incidents per year is 13. The highest number of reported fire incidents - 25 took place in 2007, and the least - 3 in 2006. The data has a declining trend.
The average number of yearly fire incidents per 10k residents in Maryville, IL compared to nearest cities:
(Note: Based on data for the last 3 years, including only cities with population 5,000 and above)
| Maryville: | 3.8 |
| Glen Carbon: | 17.8 |
| Troy: | 44.4 |
| Collinsville: | 53.9 |
| Edwardsville: | 34.3 |
| Pontoon Beach: | 67.6 |
| Granite City: | 49.8 |
| Fairview Heights: | 48.7 |
| Wood River: | 55.0 |

 31.5% incidents where reported in the morning and 68.5% in the evening. The most fires (17.2%) took place on Tuesday, and the least (10.3%) on Thursday.
 Based on the 203 fire incidents from years 2002 - 2017 most fires (14.3%) took place during March, and the least (4.4%) in July.
 Out of all 907 cases reported during the years 2002 - 2017, the most belonged to the categories: Rescue & EMS (27.7%), Fire (22.4%), and Service Call (17.8%).
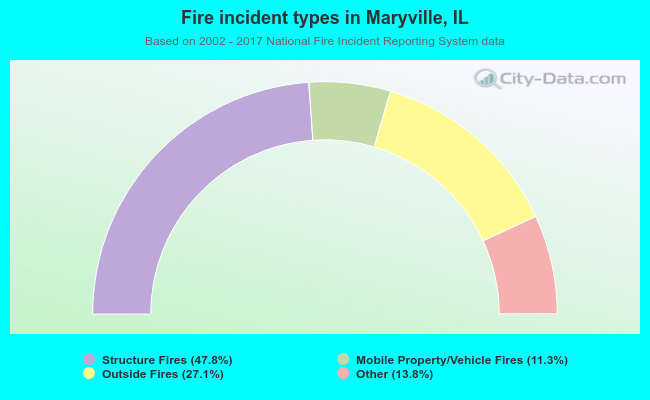 When looking into fire subcategories, the most incidents belonged to: Structure Fires (47.8%), and Outside Fires (27.1%).