Silver Springs: Fire Incidents, Nevada (NV)
Where are fire incidents reported in Silver Springs, NV
Something went wrong! Please refresh the page.
|
| |||||||||||||||||||||||||||||||||||||||||||||||||||||||||||||||||||||||||||||||||||||||||||||||||||||||||||||
| Other | 65 | |||||||||||||||||||||||||||||||||||||||||||||||||||||||||||||||||||||||||||||||||||||||||||||||||||||||||||||
2002 - 2018 National Fire Incident Reporting System (NFIRS) incidents
- Incident types reported to NFIRS in Silver Springs, NV
- 4,12067.8%Rescue & EMS
- 75212.4%Service Call
- 4898.0%Fire
- 3866.4%Good Intent Call
- 1702.8%Hazardous Condition
- 1522.5%False Alarm
- Fire incident types reported to NFIRS in Silver Springs, NV
- 21744.4%Outside Fires
- 17535.8%Structure Fires
- 7014.3%Mobile Property/Vehicle Fires
- 275.5%Other
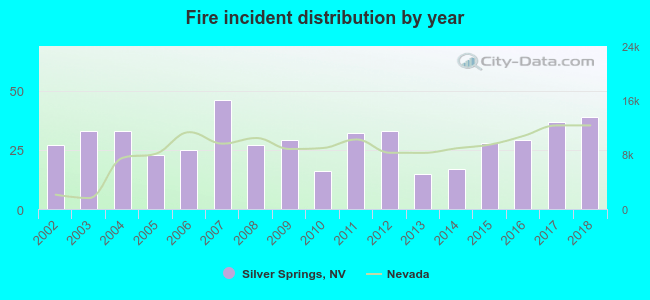 Based on the data from the years 2002 - 2018 the average number of fire incidents per year is 29. The highest number of fires - 46 took place in 2007, and the least - 15 in 2013. The data has a growing trend.
The average number of yearly fire incidents per 10k residents in Silver Springs, NV compared to nearest cities:
(Note: Based on data for the last 3 years, including only cities with population 5,000 and above)
| Silver Springs: | 66.1 |
| Fernley: | 29.5 |
| Dayton: | 45.0 |
| Fallon: | 195.2 |
| Sparks: | 38.7 |
| Washoe Valley: | 14.4 |
| Carson City: | 28.3 |
| Spanish Springs: | 2.4 |
| Sun Valley: | 16.9 |

 According to the reports from the years 2002 - 2018 the average number of fire-related yearly deaths is 0. The highest number of deaths - 1 took place in 2003, and the lowest - 0 in 2002. The data has a rising trend.
 Based on the data from the years 2002 - 2018 the average number of fire-related yearly casualties is 0. The highest number of casualties - 5 took place in 2003, and the lowest - 0 in 2002. The data has a constant trend.
 31.1% incidents where reported in the morning and 68.9% in the evening. The most fires (15.7%) took place on Thursday, and the least (12.1%) on Saturday.
 Based on the 489 reports from years 2002 - 2018 most fires (17.8%) took place during June, and the least (3.1%) in March.
 Out of all 6,078 cases reported during the years 2002 - 2018, the most belonged to the categories: Rescue & EMS (67.8%), Service Call (12.4%), and Fire (8.0%).
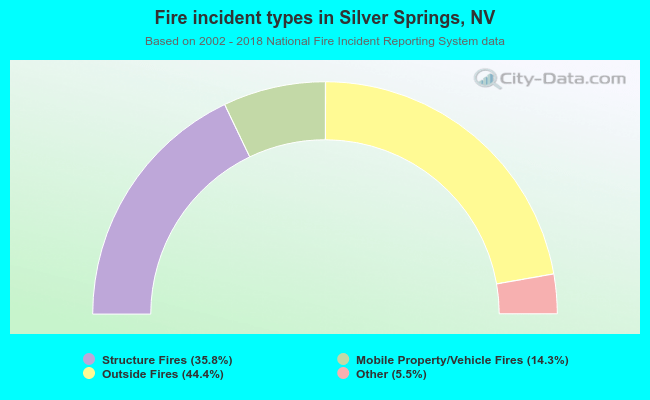 When looking into fire subcategories, the most incidents belonged to: Outside Fires (44.4%), and Structure Fires (35.8%).