Fernley: Fire Incidents, Nevada (NV)
Where are fire incidents reported in Fernley, NV
Something went wrong! Please refresh the page.
| Fire incidents reported | |
|---|---|
| Sreet name | Count |
| HWY 95A | 80 |
| FARM DISTRICT RD | 70 |
| NEWLANDS DR | 56 |
| I-80 | 50 |
| MAIN ST | 44 |
| TRUCK INN WAY | 34 |
| HWY 50 | 22 |
| NEWLANDS | 20 |
| FARM DISTRICT ROAD | 16 |
| CEDAR ST | 14 |
| FARM DISTRICT | 14 |
| HARDIE LN | 14 |
| INGLEWOOD DR | 14 |
| LYON DR | 14 |
| TRUCK INN WAY | 14 |
| G ST | 12 |
| SPEEDWAY RD | 12 |
| VILLA WAY | 12 |
| EMIGRANT WAY | 10 |
| FREMONT ST | 10 |
| MESA DR | 10 |
| MOUNTAIN ROSE DR | 10 |
| NEWLANDS DRIVE | 10 |
| PEPPER LN | 10 |
| SHADOW LN | 10 |
| VINE ST | 10 |
| 95A | 8 |
| CENTER ST | 8 |
| COUNTRY DR | 8 |
| HIGHWAY 95 ALT HWY | 8 |
| Other | 501 |
2002 - 2018 National Fire Incident Reporting System (NFIRS) incidents
- Incident types reported to NFIRS in Fernley, NV
- 4,84862.4%Rescue & EMS
- 1,12514.5%Fire
- 5166.6%Good Intent Call
- 4405.7%Service Call
- 4375.6%Hazardous Condition
- 3694.8%False Alarm
- 250.3%Special Incident
- Fire incident types reported to NFIRS in Fernley, NV
- 51445.7%Outside Fires
- 32228.6%Structure Fires
- 15313.6%Mobile Property/Vehicle Fires
- 13612.1%Other
 Based on the data from the years 2002 - 2018 the average number of fire incidents per year is 66. The highest number of fire incidents - 127 took place in 2011, and the least - 4 in 2002. The data has a growing trend.
The average number of yearly fire incidents per 10k residents in Fernley, NV compared to nearest cities:
(Note: Based on data for the last 3 years, including only cities with population 5,000 and above)
| Fernley: | 29.5 |
| Silver Springs: | 66.1 |
| Fallon: | 195.2 |
| Spanish Springs: | 2.4 |
| Sparks: | 38.7 |
| Sun Valley: | 16.9 |
| Dayton: | 45.0 |
| Reno: | 41.0 |
| Lemmon Valley: | 2.0 |
 The median response time based on all reported fire incidents is 9 minutes. This is higher than the state median value.
The median response time in Fernley, NV compared to nearest cities:
(Note: Based on data for all years, including only cities with at least 500 fire incidents)
| Fernley: | 9 minutes |
| Fallon: | 7 minutes |
| Sparks: | 6 minutes |
| Virginia City: | 8 minutes |
| Dayton: | 7 minutes |
| Reno: | 7 minutes |
| Carson City: | 6 minutes |
| Yerington: | 9 minutes |
| Gardnerville: | 9 minutes |
 According to the data from the years 2002 - 2018 the average number of fire-related casualties per year is 0. The highest number of injuries - 2 took place in 2017, and the lowest - 0 in 2002. The data has a constant trend.
The average number of casualties per 1,000 fire incidents is 3. This indicator was the highest - 22 in 2012, and the lowest 0 in 2002. The trend for casualties per 1,000 fire incidents is constant. Compared to the Nevada value the number of injuries per 1,000 fire incidents is much lower.
According to the data from the years 2002 - 2018 the average number of fire-related casualties per year is 0. The highest number of injuries - 2 took place in 2017, and the lowest - 0 in 2002. The data has a constant trend.
The average number of casualties per 1,000 fire incidents is 3. This indicator was the highest - 22 in 2012, and the lowest 0 in 2002. The trend for casualties per 1,000 fire incidents is constant. Compared to the Nevada value the number of injuries per 1,000 fire incidents is much lower.Casualties per 1,000 incidents in Fernley, NV compared to nearest cities:
(Note: Based on data for all years, including only cities with at least 500 fire incidents)
| Fernley: | 3.6 |
| Fallon: | 2.2 |
| Sparks: | 11.4 |
| Virginia City: | 0.0 |
| Dayton: | 10.4 |
| Reno: | 6.9 |
| Carson City: | 14.7 |
| Yerington: | 3.0 |
| Gardnerville: | 0.0 |
 29.9% incidents where reported in the morning and 70.1% in the evening. The most fires (15.6%) took place on Sunday, and the least (13.0%) on Thursday.
 According to the 1,125 incident reports from years 2002 - 2018 most fires (13.2%) took place during May, and the least (5.4%) in December.
 Out of all 7,766 cases reported during the years 2002 - 2018, the most belonged to the categories: Rescue & EMS (62.4%), Fire (14.5%), and Good Intent Call (6.6%).
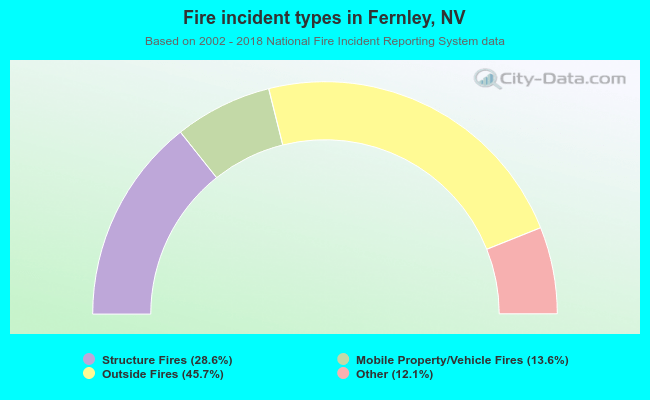 When looking into fire subcategories, the most reports belonged to: Outside Fires (45.7%), and Structure Fires (28.6%).