Bellport: Fire Incidents, New York (NY)
Where are fire incidents reported in Bellport, NY
Something went wrong! Please refresh the page.
|
| |||||||||||||||||||||||||||||||||||||||||||||||||||||||||||||||||||||||||||||||||||||||||||||||||||||||||||||
2003 - 2018 National Fire Incident Reporting System (NFIRS) incidents
- Incident types reported to NFIRS in Bellport, NY
- 73331.9%False Alarm
- 57625.1%Fire
- 47220.5%Hazardous Condition
- 2289.9%Rescue & EMS
- 1536.7%Good Intent Call
- 1325.7%Service Call
- Fire incident types reported to NFIRS in Bellport, NY
- 29751.6%Structure Fires
- 19233.3%Outside Fires
- 7613.2%Mobile Property/Vehicle Fires
- 111.9%Other
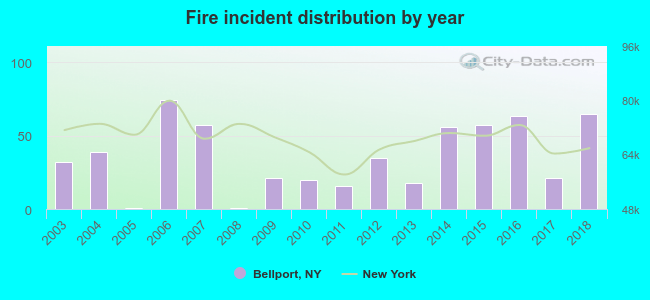 Based on the data from the years 2003 - 2018 the average number of fire incidents per year is 36. The highest number of fires - 74 took place in 2006, and the least - 1 in 2005. The data has a growing trend.
 The median response time based on all reported fire incidents is 5 minutes. This is higher than the New York median value.
The median response time in Bellport, NY compared to nearest cities:
(Note: Based on data for all years, including only cities with at least 500 fire incidents)
| Bellport: | 5 minutes |
| East Patchogue: | 4 minutes |
| Patchogue: | 4 minutes |
| Shirley: | 7 minutes |
| Medford: | 4 minutes |
| Mastic Beach: | 6 minutes |
| Holbrook: | 4 minutes |
| Middle Island: | 7 minutes |
| Bohemia: | 4 minutes |
 31.6% incidents where reported in the morning and 68.4% in the evening. The most fires (18.2%) took place on Monday, and the least (12.0%) on Thursday.
 Based on the 576 fire incident reports from years 2003 - 2018 most fires (11.5%) took place during August, and the least (6.4%) in September.
 Out of all 2,298 cases reported during the years 2003 - 2018, the most belonged to the categories: Good Intent Call (31.9%), Fire (25.1%), and Rescue & EMS (20.5%).
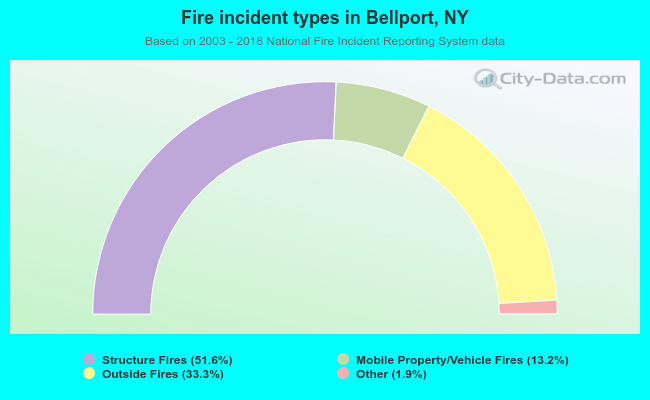 When looking into fire subcategories, the most reports belonged to: Structure Fires (51.6%), and Outside Fires (33.3%).