East Patchogue: Fire Incidents, New York (NY)
Where are fire incidents reported in East Patchogue, NY
Something went wrong! Please refresh the page.
|
| |||||||||||||||||||||||||||||||||||||||||||||||||||||||||||||||||||||||||||||||||||||||||||||||||||||||||||||
2003 - 2018 National Fire Incident Reporting System (NFIRS) incidents
- Incident types reported to NFIRS in East Patchogue, NY
- 67624.3%Fire
- 64723.3%Rescue & EMS
- 59121.2%False Alarm
- 42315.2%Hazardous Condition
- 2197.9%Good Intent Call
- 2177.8%Service Call
- 50.2%Special Incident
- 30.1%Overpressure Rupture
- Fire incident types reported to NFIRS in East Patchogue, NY
- 40459.8%Structure Fires
- 18928.0%Outside Fires
- 6810.1%Mobile Property/Vehicle Fires
- 152.2%Other
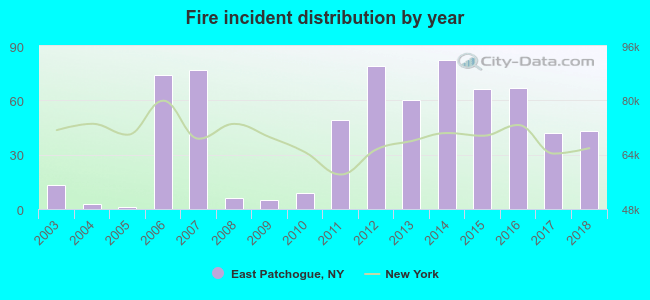 According to the data from the years 2003 - 2018 the average number of fire incidents per year is 42. The highest number of reported fires - 82 took place in 2014, and the least - 1 in 2005. The data has a growing trend.
The average number of yearly fire incidents per 10k residents in East Patchogue, NY compared to nearest cities:
(Note: Based on data for the last 3 years, including only cities with population 5,000 and above)
| East Patchogue: | 22.5 |
| Patchogue: | 85.5 |
| North Patchogue: | 2.3 |
| Medford: | 37.3 |
| Bayport: | 7.1 |
| Holtsville: | 9.6 |
| Holbrook: | 12.7 |
| Sayville: | 13.4 |
| Yaphank: | 26.4 |
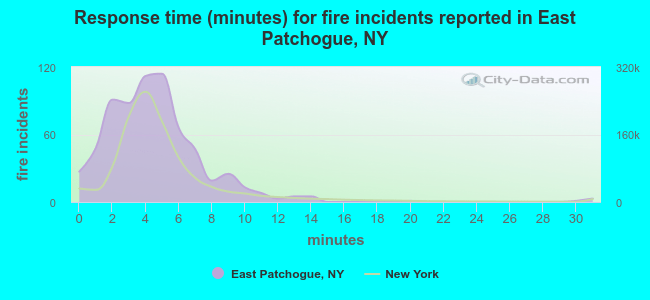 The median response time based on all reported fire incidents is 4 minutes. This is similar to the New York median value.
The median response time in East Patchogue, NY compared to nearest cities:
(Note: Based on data for all years, including only cities with at least 500 fire incidents)
| East Patchogue: | 4 minutes |
| Patchogue: | 4 minutes |
| Bellport: | 5 minutes |
| Medford: | 4 minutes |
| Holbrook: | 4 minutes |
| Shirley: | 7 minutes |
| Bohemia: | 4 minutes |
| Mastic Beach: | 6 minutes |
| Selden: | 4 minutes |
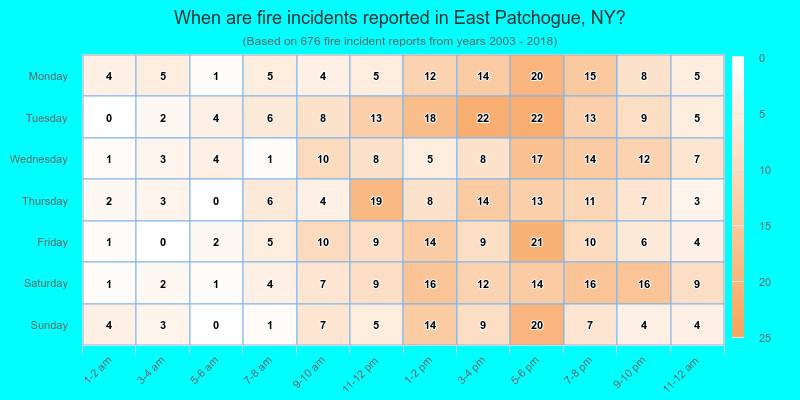
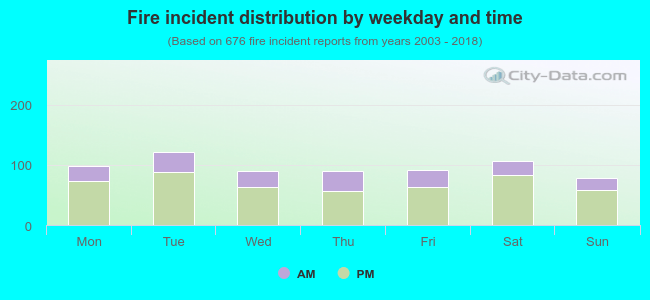 28.0% incidents where reported in the morning and 72.0% in the evening. The most fires (18.0%) took place on Tuesday, and the least (11.5%) on Sunday.
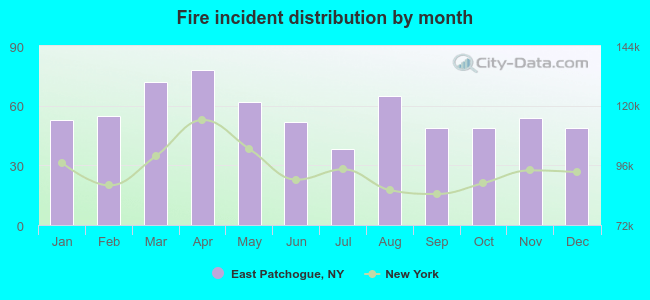 Based on the 676 reports from years 2003 - 2018 most fires (11.5%) took place during April, and the least (5.6%) in July.
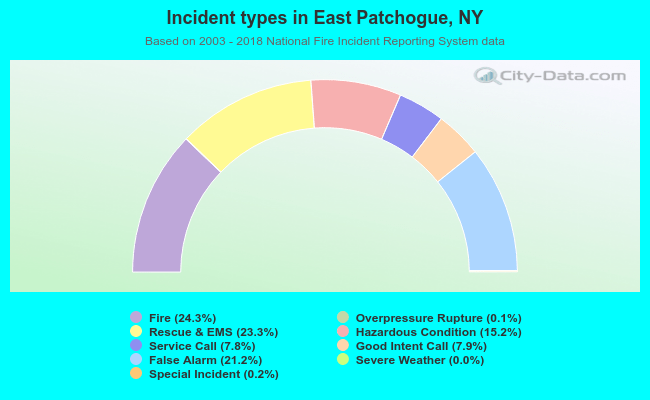 Out of all 2,782 cases reported during the years 2003 - 2018, the most belonged to the categories: Fire (24.3%), Rescue & EMS (23.3%), and False Alarm (21.2%).
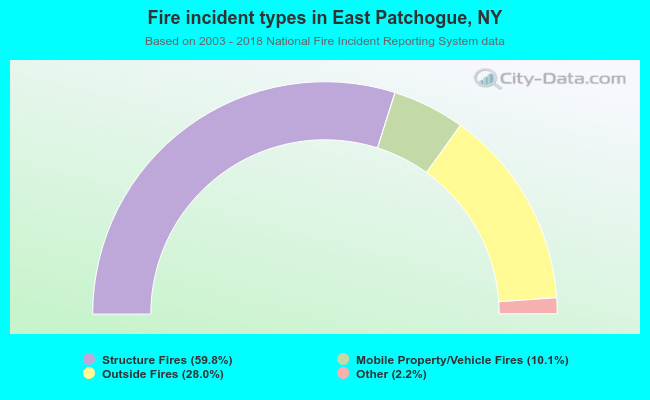 When looking into fire subcategories, the most incidents belonged to: Structure Fires (59.8%), and Outside Fires (28.0%).