Blooming Grove: Fire Incidents, New York (NY)
Where are fire incidents reported in Blooming Grove, NY
Something went wrong! Please refresh the page.
|
| |||||||||||||||||||||||||||||||||||||||||||||||||||||||||||||||||||||||||||||||||||||||||||||||||||||||||||||
2002 - 2018 National Fire Incident Reporting System (NFIRS) incidents
- Incident types reported to NFIRS in Blooming Grove, NY
- 22521.4%Hazardous Condition
- 20019.0%Fire
- 19318.3%Service Call
- 17816.9%Rescue & EMS
- 15514.7%False Alarm
- 959.0%Good Intent Call
- 60.6%Overpressure Rupture
- Fire incident types reported to NFIRS in Blooming Grove, NY
- 10854.0%Structure Fires
- 5025.0%Outside Fires
- 2512.5%Other
- 178.5%Mobile Property/Vehicle Fires
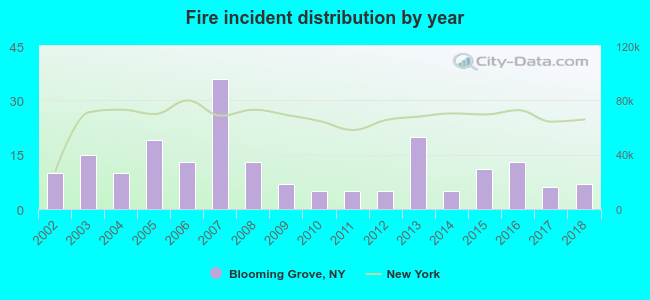 According to the data from the years 2002 - 2018 the average number of fires per year is 12. The highest number of reported fire incidents - 36 took place in 2007, and the least - 5 in 2010. The data has a declining trend.
The average number of yearly fire incidents per 10k residents in Blooming Grove, NY compared to nearest cities:
(Note: Based on data for the last 3 years, including only cities with population 5,000 and above)
| Blooming Grove: | 4.8 |
| Washingtonville: | 29.9 |
| Kiryas Joel: | 1.2 |
| Monroe: | 267.1 |
| Cornwall: | 7.4 |
| Goshen: | 65.6 |
| New Windsor: | 76.2 |
| Newburgh: | 65.5 |
| Walden: | 23.8 |
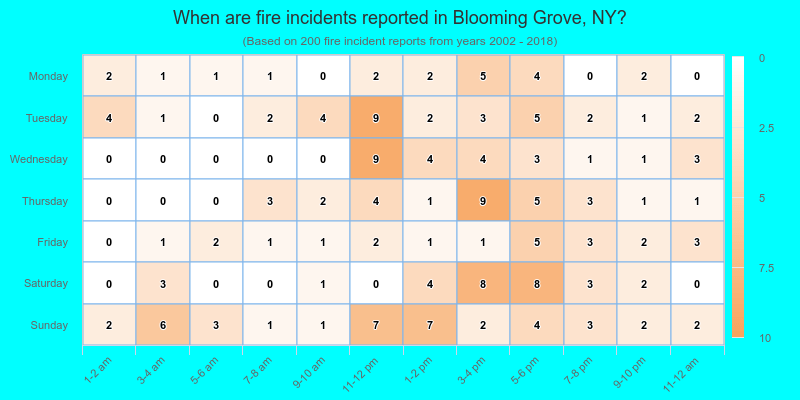
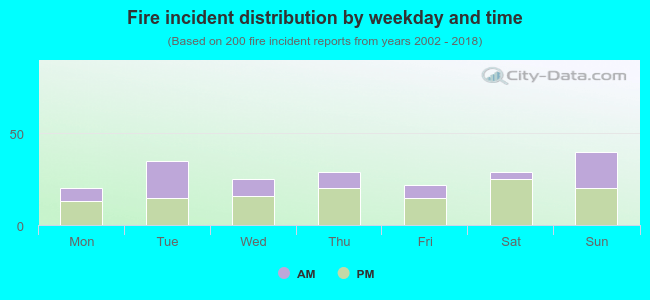 38.0% incidents where reported in the morning and 62.0% in the evening. The most fires (20.0%) took place on Sunday, and the least (10.0%) on Monday.
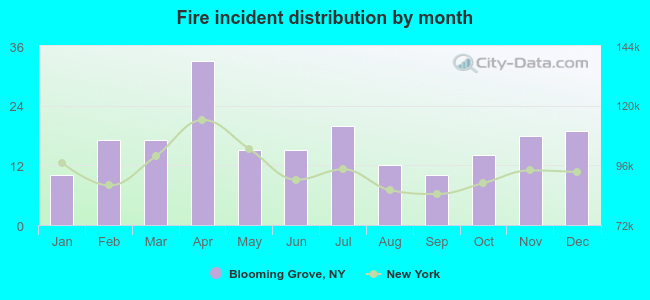 Based on the 200 fire incidents from years 2002 - 2018 most fires (16.5%) took place during April, and the least (5.0%) in January.
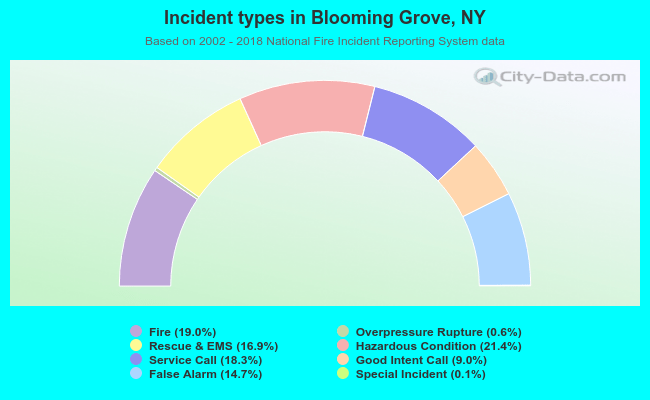 Out of all 1,053 cases reported during the years 2002 - 2018, the most belonged to the categories: Hazardous Condition (21.4%), Fire (19.0%), and Service Call (18.3%).
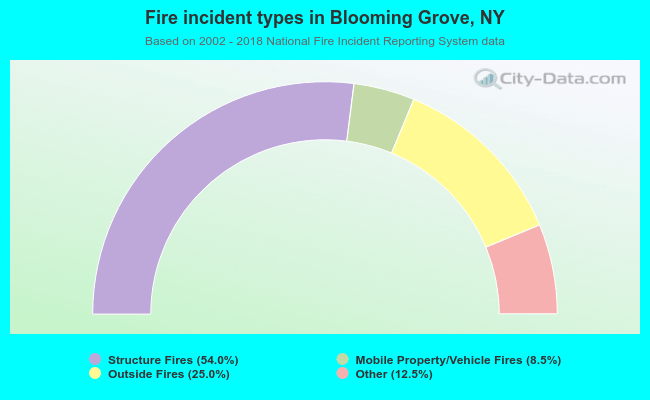 When looking into fire subcategories, the most reports belonged to: Structure Fires (54.0%), and Outside Fires (25.0%).