Monroe: Fire Incidents, New York (NY)
Where are fire incidents reported in Monroe, NY
Something went wrong! Please refresh the page.
| Fire incidents reported | |
|---|---|
| Sreet name | Count |
| MOUNTAIN RD | 166 |
| SCHUNNEMUNK RD | 150 |
| GETZEL BERGER BLVD | 122 |
| FOREST RD | 120 |
| RT 17M | 112 |
| MERON DR | 100 |
| ACRES RD | 90 |
| VAN BUREN DR | 80 |
| GARFIELD RD | 78 |
| KOZNITS RD | 72 |
| QUICKWAY RD | 72 |
| RAYWOOD DR | 72 |
| FILLMORE CT | 70 |
| LEMBERG WAY | 70 |
| SATMAR DR | 70 |
| LIZENSK BLVD | 62 |
| PRAG WAY | 62 |
| DAWEIDER BLVD | 56 |
| ISRAEL ZUPNICK DR | 52 |
| ZENTA RD | 52 |
| APTA WAY | 46 |
| BARDICHEV CT | 46 |
| BERDICHEV RD | 44 |
| KARLIN BLVD | 44 |
| SEVEN SPRINGS RD | 44 |
| DINEV CT | 42 |
| RT 17 | 42 |
| EAHAL CT | 40 |
| MORDCHE SCHER BLVD | 40 |
| RUZHIN RD | 40 |
| Other | 880 |
2002 - 2018 National Fire Incident Reporting System (NFIRS) incidents
- Incident types reported to NFIRS in Monroe, NY
- 4,31129.3%Hazardous Condition
- 3,03620.6%Fire
- 2,67018.1%False Alarm
- 1,83012.4%Rescue & EMS
- 1,57210.7%Good Intent Call
- 1,2568.5%Service Call
- 200.1%Overpressure Rupture
- 160.1%Severe Weather
- Fire incident types reported to NFIRS in Monroe, NY
- 1,34644.3%Outside Fires
- 1,29642.7%Structure Fires
- 2337.7%Other
- 1615.3%Mobile Property/Vehicle Fires
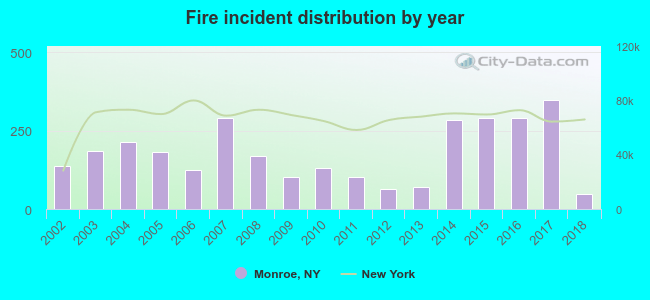 According to the data from the years 2002 - 2018 the average number of fire incidents per year is 179. The highest number of reported fire incidents - 347 took place in 2017, and the least - 49 in 2018. The data has a declining trend.
The average number of yearly fire incidents per 10k residents in Monroe, NY compared to nearest cities:
(Note: Based on data for the last 3 years, including only cities with population 5,000 and above)
| Monroe: | 267.1 |
| Kiryas Joel: | 1.2 |
| Blooming Grove: | 4.8 |
| Washingtonville: | 29.9 |
| Goshen: | 65.6 |
| Warwick: | 83.0 |
| Cornwall: | 7.4 |
| Stony Point: | 17.0 |
| Mount Ivy: | 1.5 |
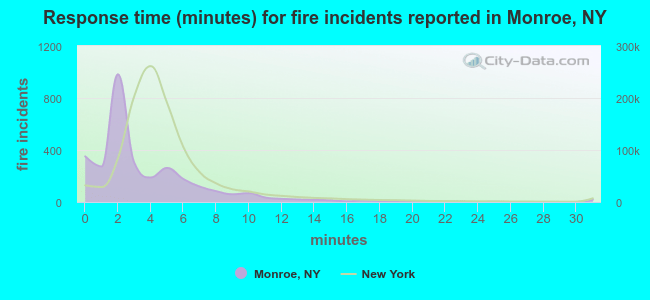 The median response time based on all reported fire incidents is 2 minutes. This is much lower compared to the New York median value.
The median response time in Monroe, NY compared to nearest cities:
(Note: Based on data for all years, including only cities with at least 500 fire incidents)
| Monroe: | 2 minutes |
| Chester: | 6 minutes |
| Goshen: | 4 minutes |
| Warwick: | 4 minutes |
| Pomona: | 5 minutes |
| Stony Point: | 4 minutes |
| New Windsor: | 7 minutes |
| Montgomery: | 6 minutes |
| Peekskill: | 3 minutes |
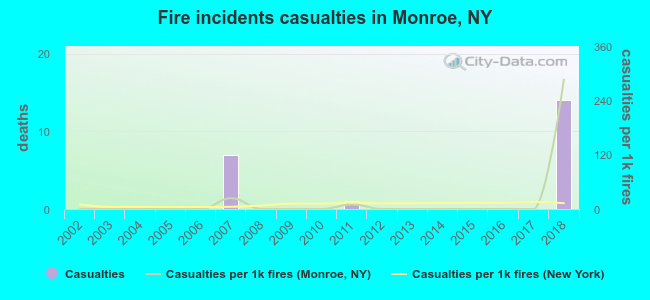 Based on the data from the years 2002 - 2018 the average number of fire-related casualties per year is 1. The highest number of casualties - 14 took place in 2018, and the lowest - 0 in 2002. The data has an increasing trend.
The average number of casualties per 1,000 fire incidents is 19. This indicator was the highest - 286 in 2018, and the lowest 0 in 2002. The trend for injuries per 1,000 fire incidents is growing. Compared to the New York value the number of injuries per 1,000 fire incidents is lower.
Based on the data from the years 2002 - 2018 the average number of fire-related casualties per year is 1. The highest number of casualties - 14 took place in 2018, and the lowest - 0 in 2002. The data has an increasing trend.
The average number of casualties per 1,000 fire incidents is 19. This indicator was the highest - 286 in 2018, and the lowest 0 in 2002. The trend for injuries per 1,000 fire incidents is growing. Compared to the New York value the number of injuries per 1,000 fire incidents is lower.Casualties per 1,000 incidents in Monroe, NY compared to nearest cities:
(Note: Based on data for all years, including only cities with at least 500 fire incidents)
| Monroe: | 7.2 |
| Chester: | 3.5 |
| Goshen: | 0.0 |
| Warwick: | 0.0 |
| Pomona: | 3.8 |
| Stony Point: | 3.1 |
| New Windsor: | 9.9 |
| Montgomery: | 0.0 |
| Peekskill: | 0.7 |
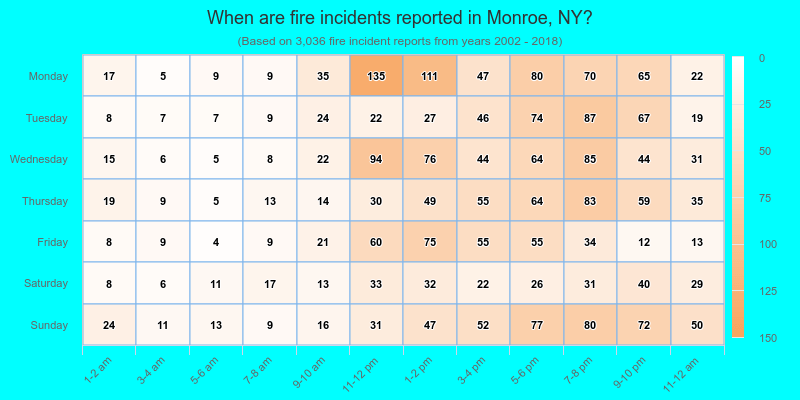
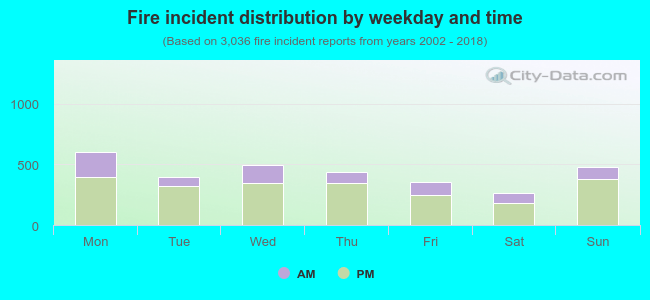 27.3% incidents where reported in the morning and 72.7% in the evening. The most fires (19.9%) took place on Monday, and the least (8.8%) on Saturday.
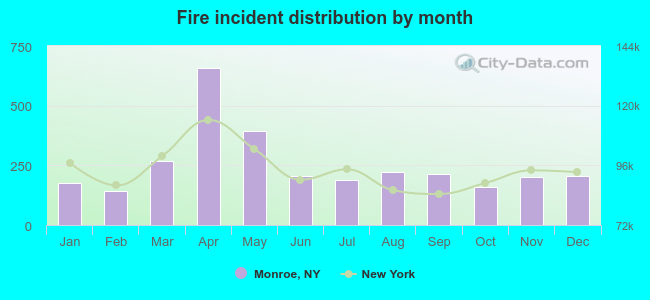 Based on the 3,036 reports from years 2002 - 2018 most fires (21.7%) took place during April, and the least (4.7%) in February.
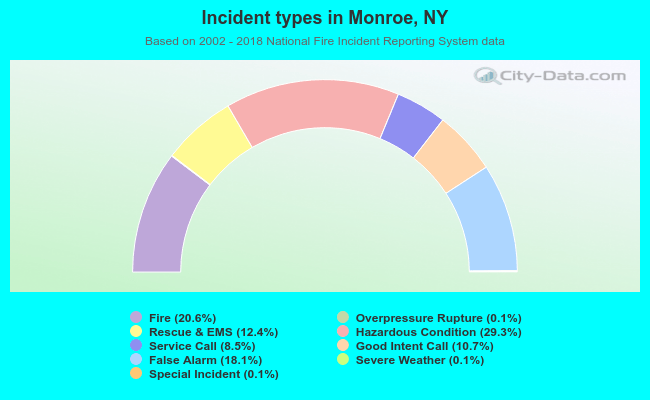 Out of all 14,724 cases reported during the years 2002 - 2018, the most belonged to the categories: Hazardous Condition (29.3%), Fire (20.6%), and False Alarm (18.1%).
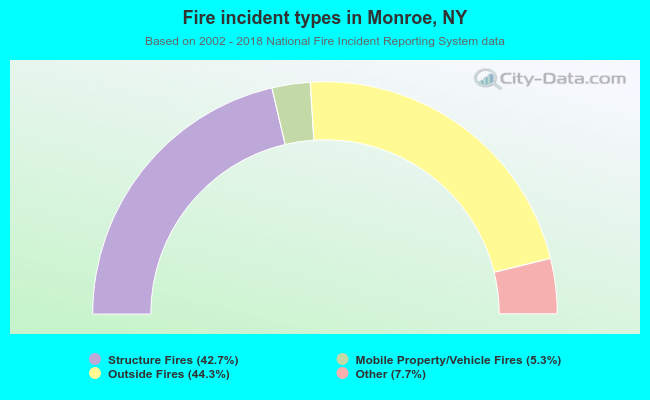 When looking into fire subcategories, the most incidents belonged to: Outside Fires (44.3%), and Structure Fires (42.7%).